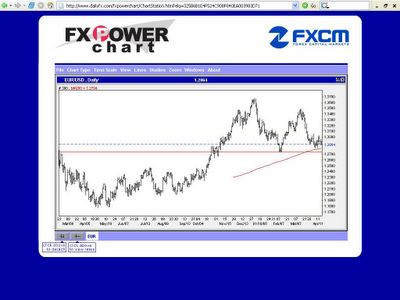
20050414 Daily chart with the 200 day sma shows the market is at the moment of truth. The larger pattern looks like a giant double top, with the neckline around 1.2800. Breaking of the 200 sma and the horizontal trendline, should target 1.2000-1.2100 for the EURUSD. If this scenario plays out, could be a prelude to a major trend reversal, and a start to the USD bull market.
 EURUSD chart
USDJPY chart
GBPUSD chart
USDCHF chart


<< Home