20050613 Since the last long term trading view in April (http://eurofxtrading.blogspot.com/2005_04_01_eurofxtrading_archive.html), now comes another interesting pattern on the EURUSD daily chart. Could point the way for the rebound to the 34 ema 1.2300-1.2400. Reason: the simplest being the triple divergence and the descending wedge pattern on the price chart.

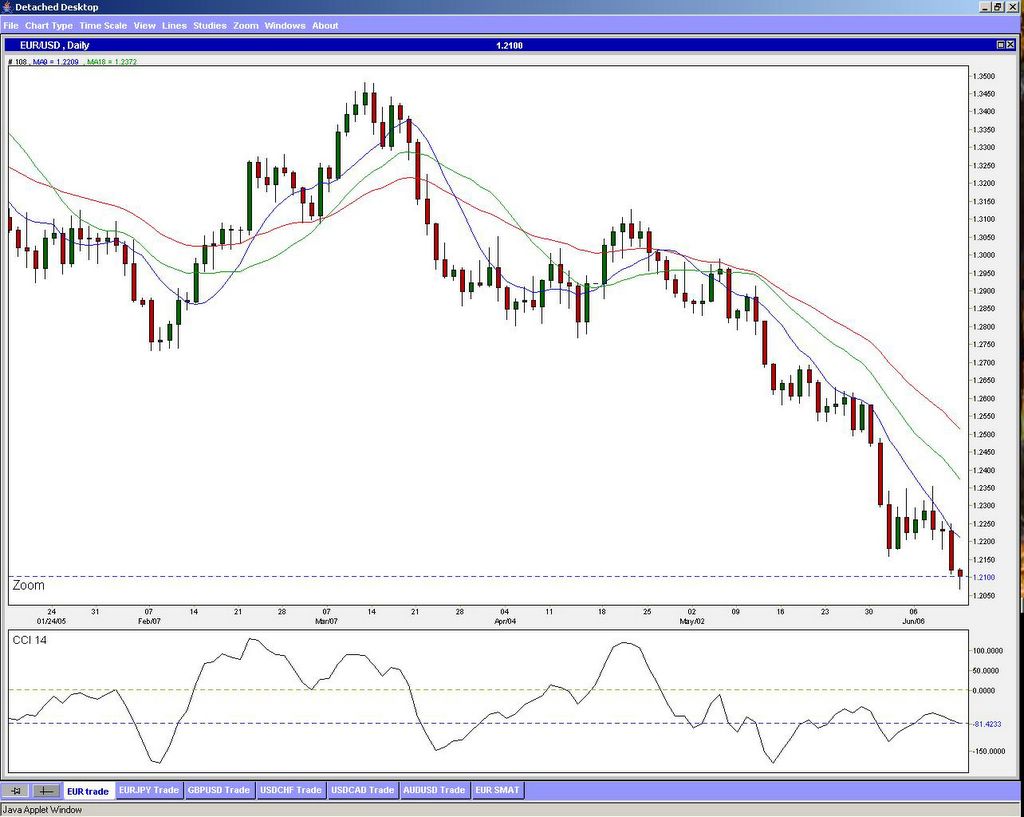 EURUSD chart
USDJPY chart
GBPUSD chart
USDCHF chart
posted by emacro @ 11:56 PM
![]()
![]()


<< Home