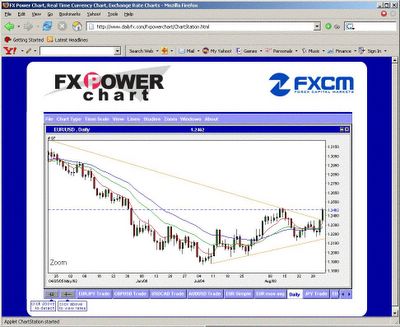
20050901 11:25 am ET. The daily cash chart shows a breakout of the downtrend line. This is aided by the fundamental shit in the Euro/USD interet rate differential where weak economic data may signal the end of the Fed tightening cycle. Be waiting for 150 pip retracement to enter long.
 EURUSD chart
USDJPY chart
GBPUSD chart
USDCHF chart


<< Home