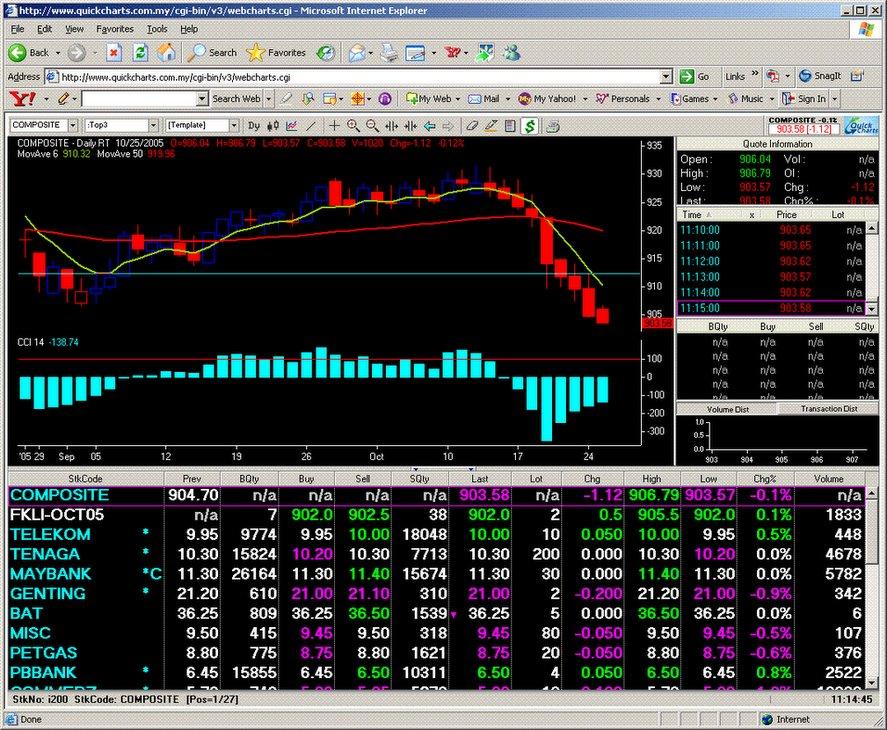
 20051025 11:05 am. The cash daily chart with the downtick this morning now shows 9 consecutive days down. May be a good time to think about long fkli positions for a 2-3 day move back up for the cash index.
  EURUSD chart
USDJPY chart
GBPUSD chart
USDCHF chart
posted by emacro @ 11:17 PM
![]()
![]()


<< Home