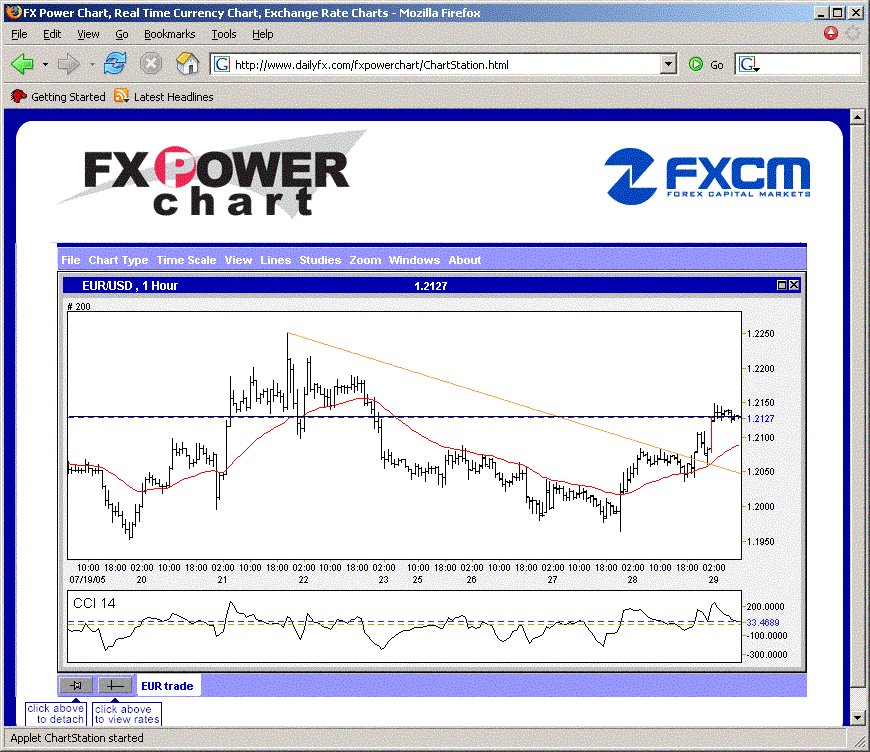
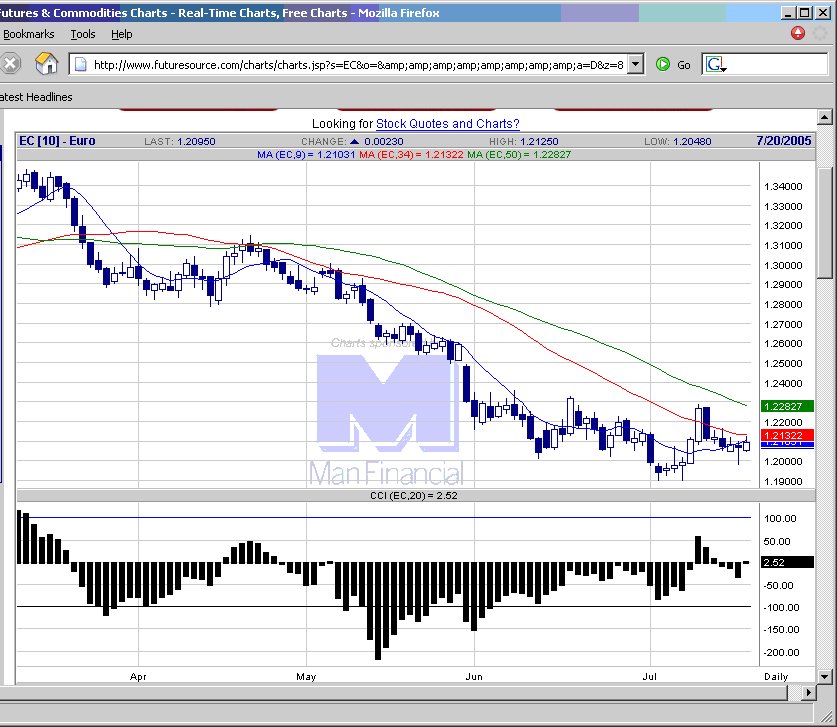
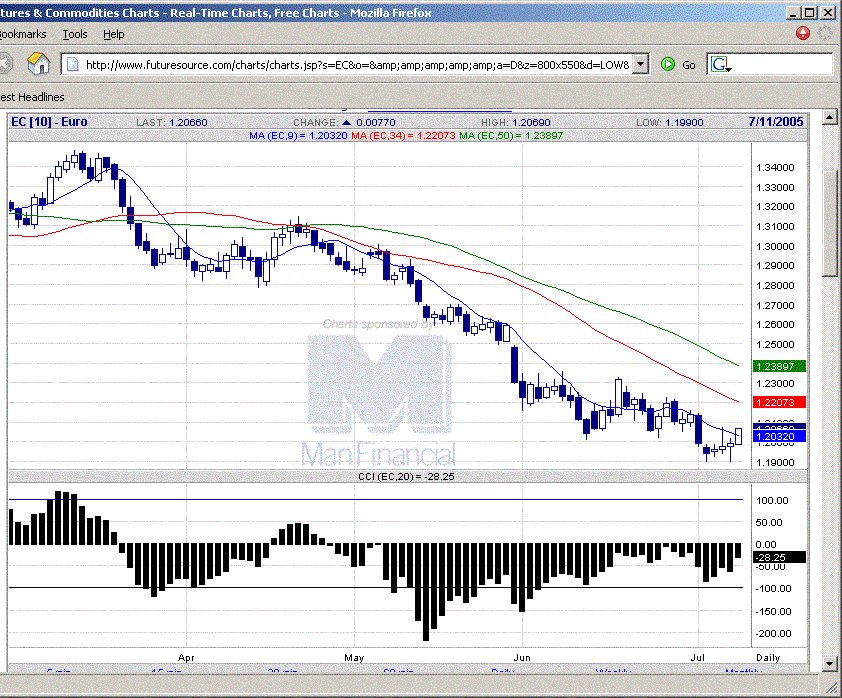
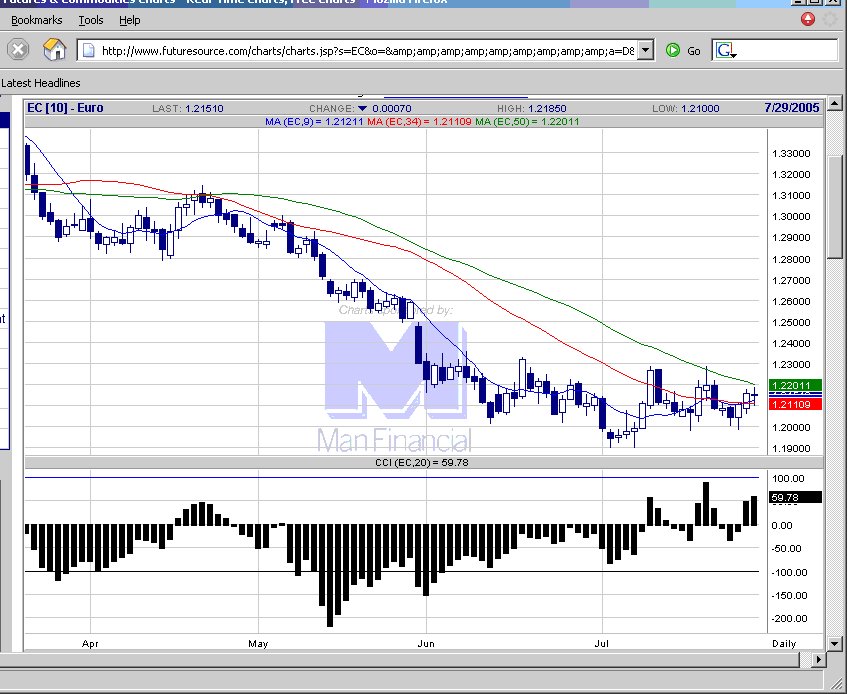
20050729 The buy signal 2 days ago would have got a good profit, depending on trade management. Today's candlestick is a doji, indicating balance between buyers and seers, with CCI between -100 and +100. Waiting for next signal. Patience is one of the vital factors in trading.

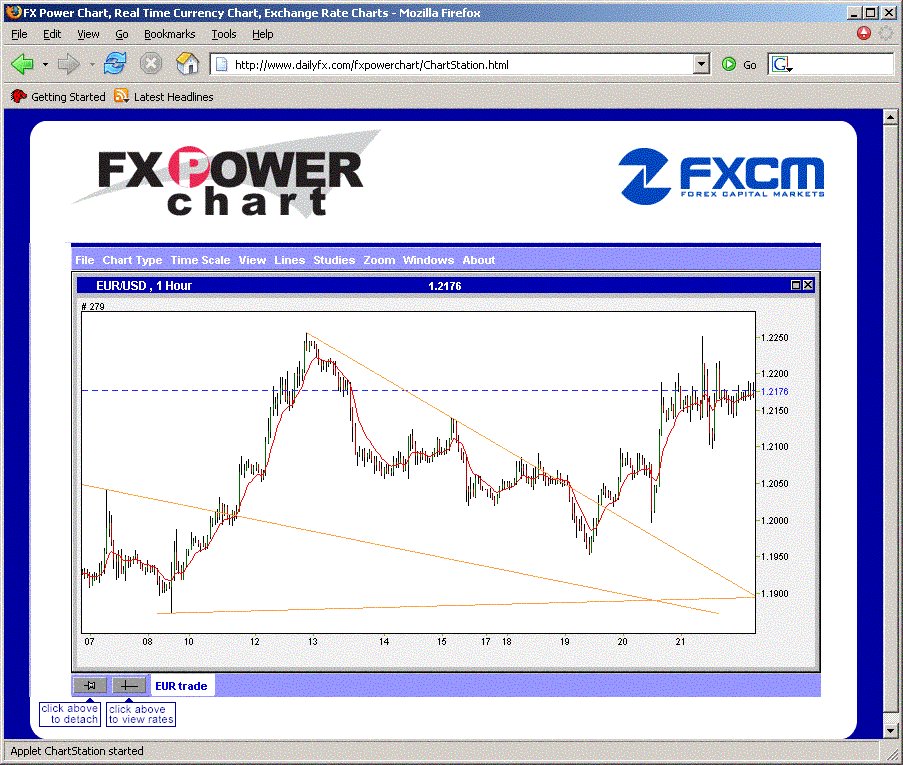
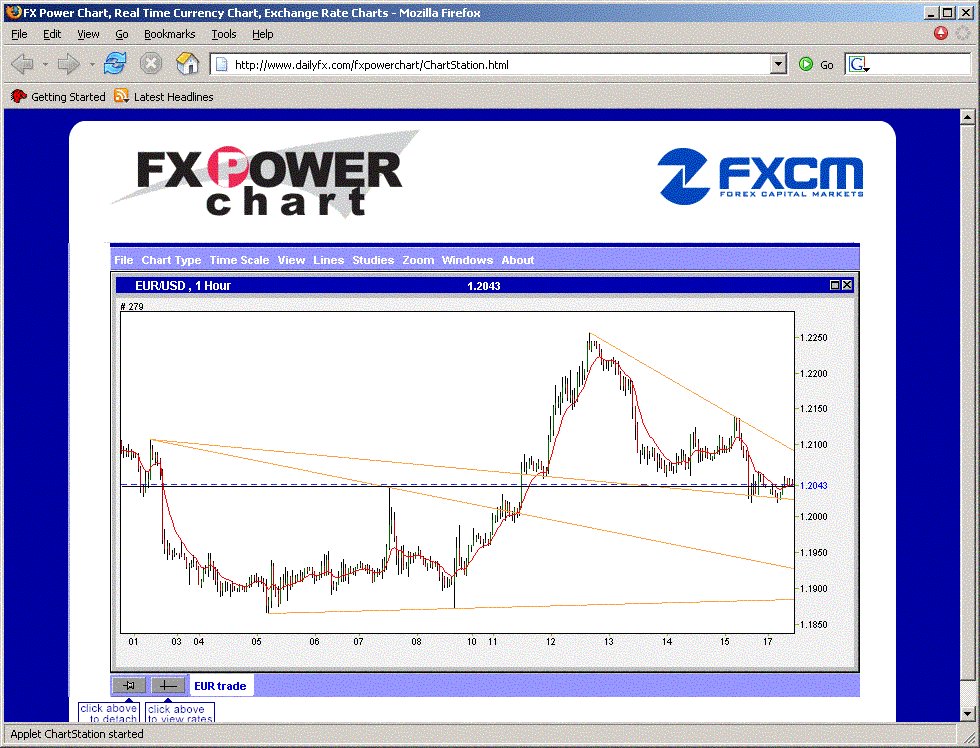
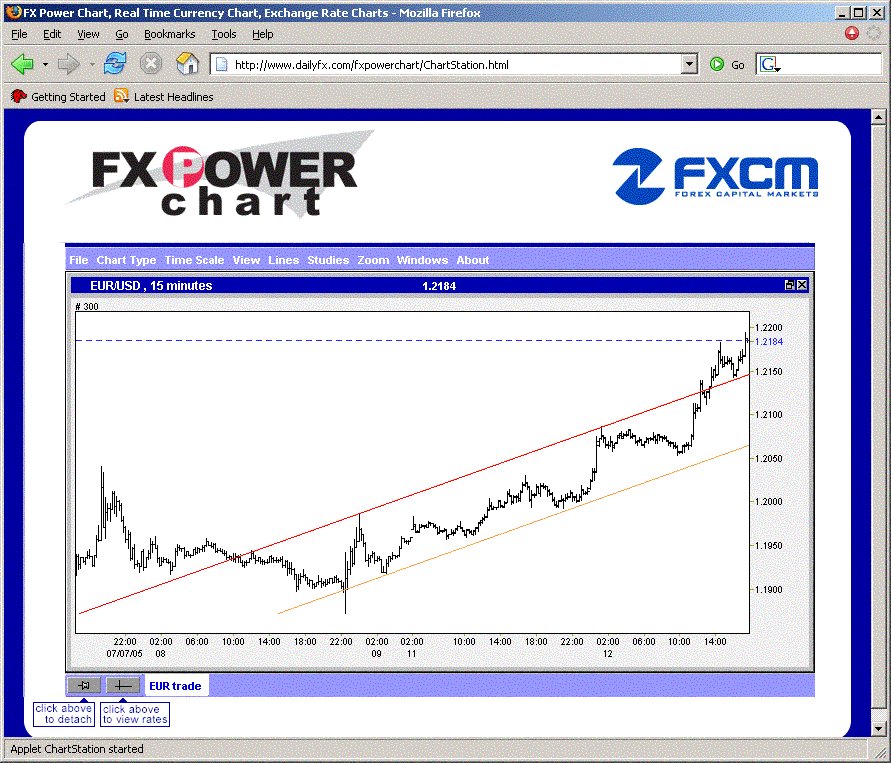
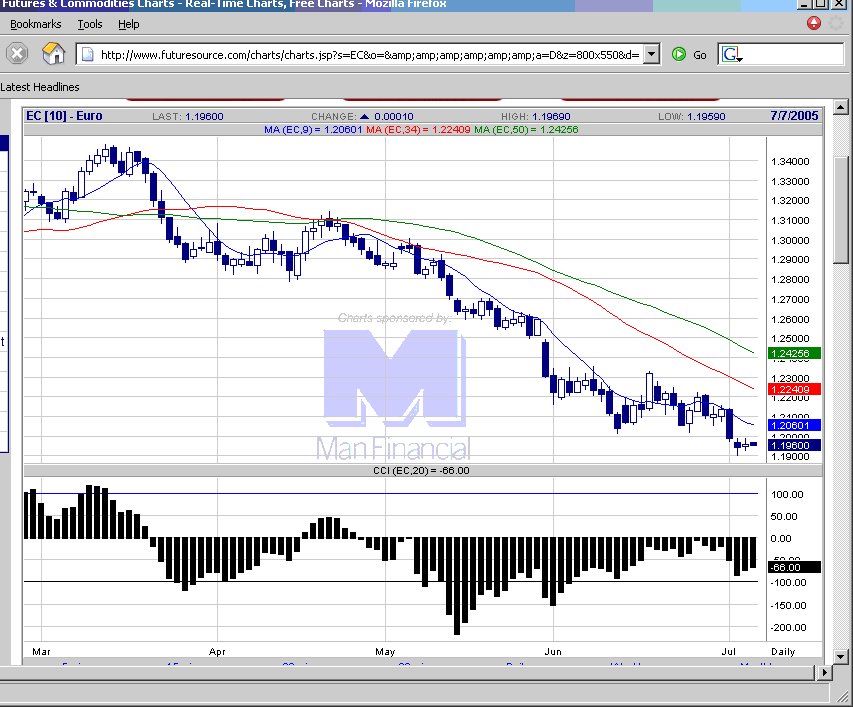
 EURUSD chart
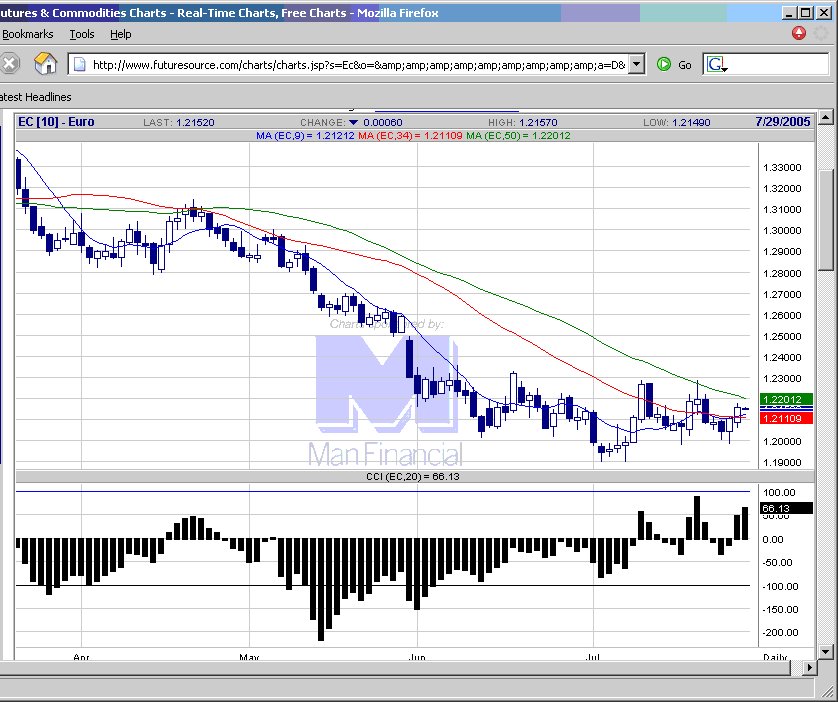
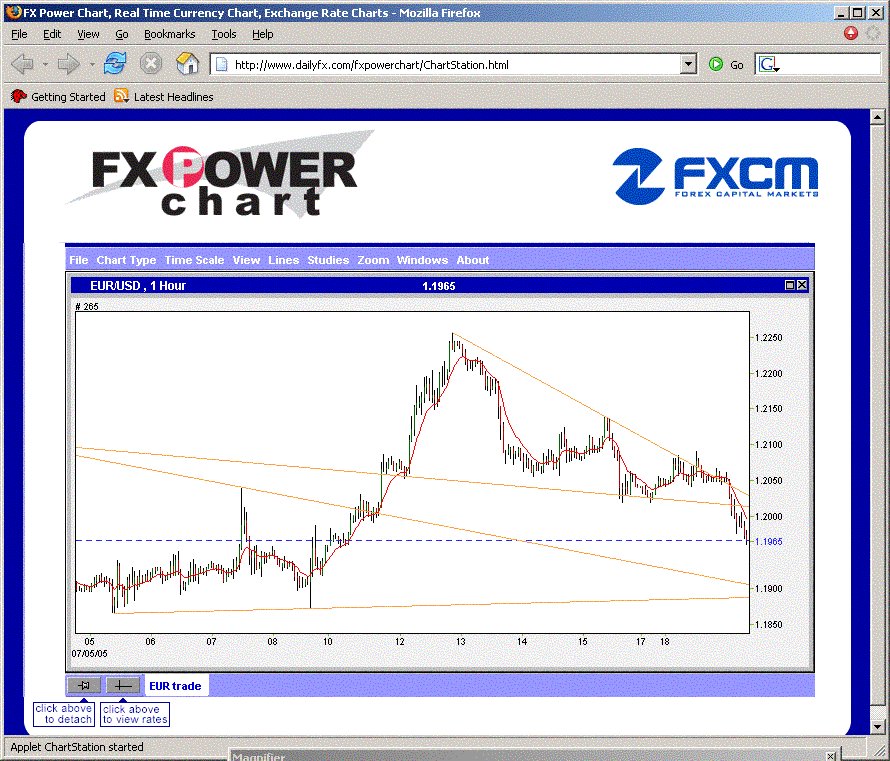
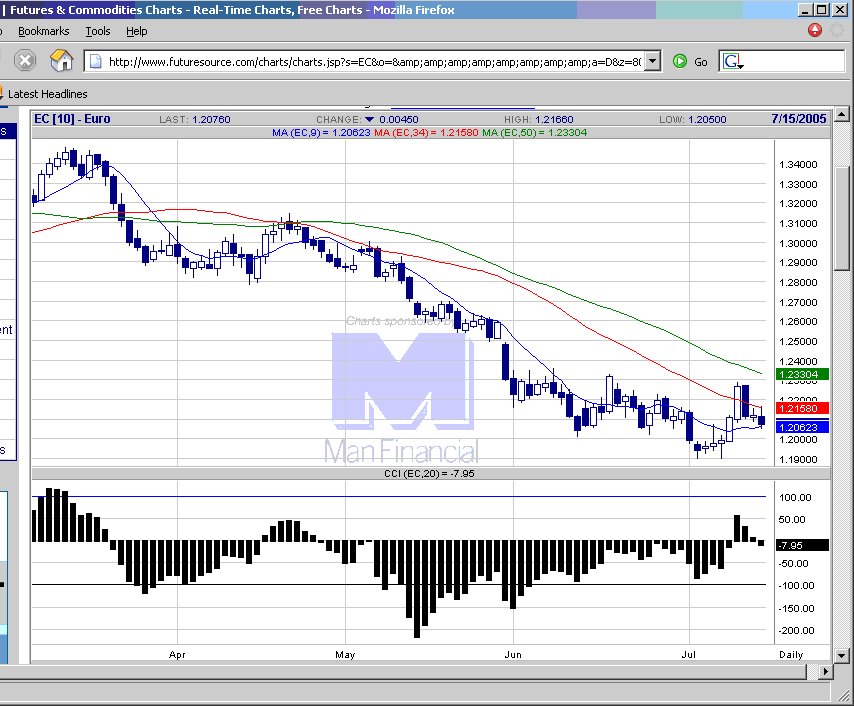
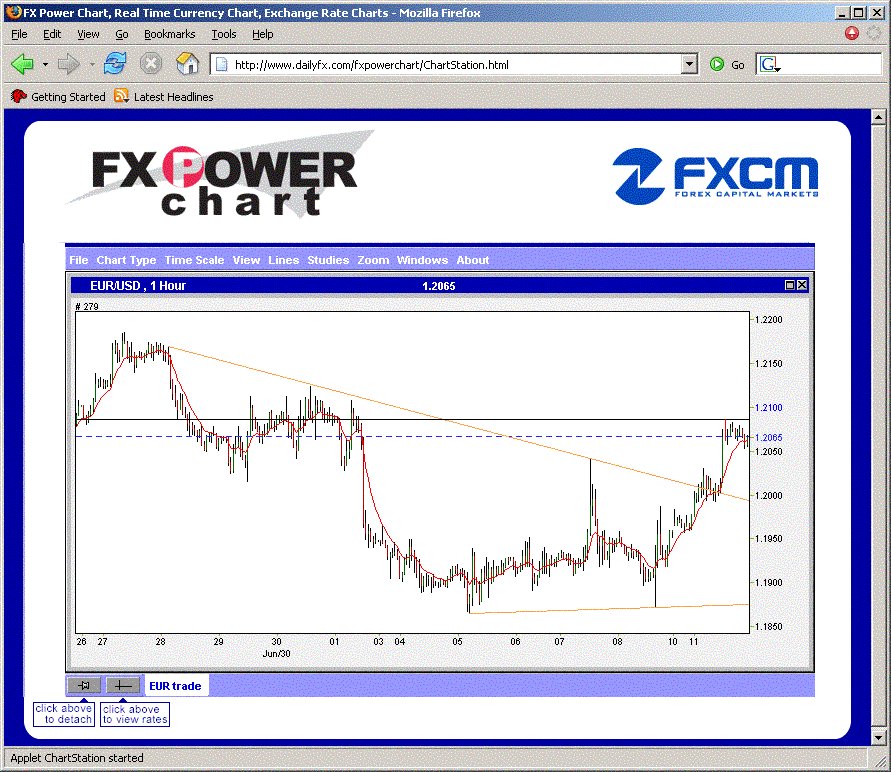
USDJPY chart
GBPUSD chart
USDCHF chart
posted by emacro @ 10:39 PM
![]()
![]()