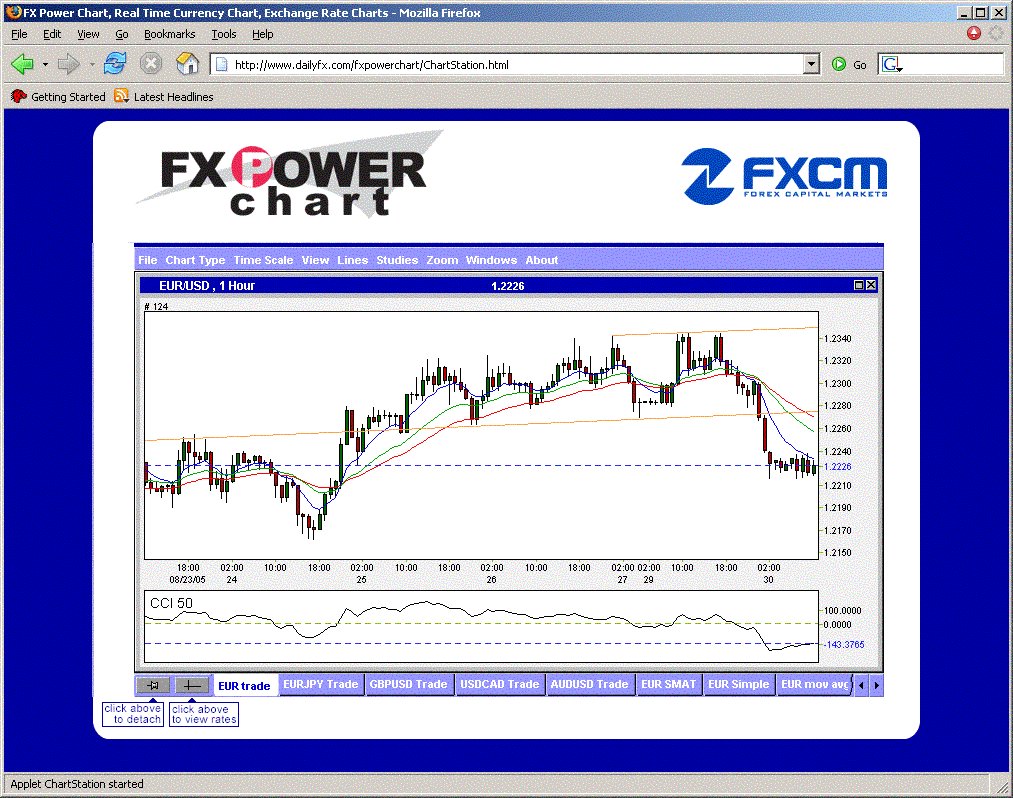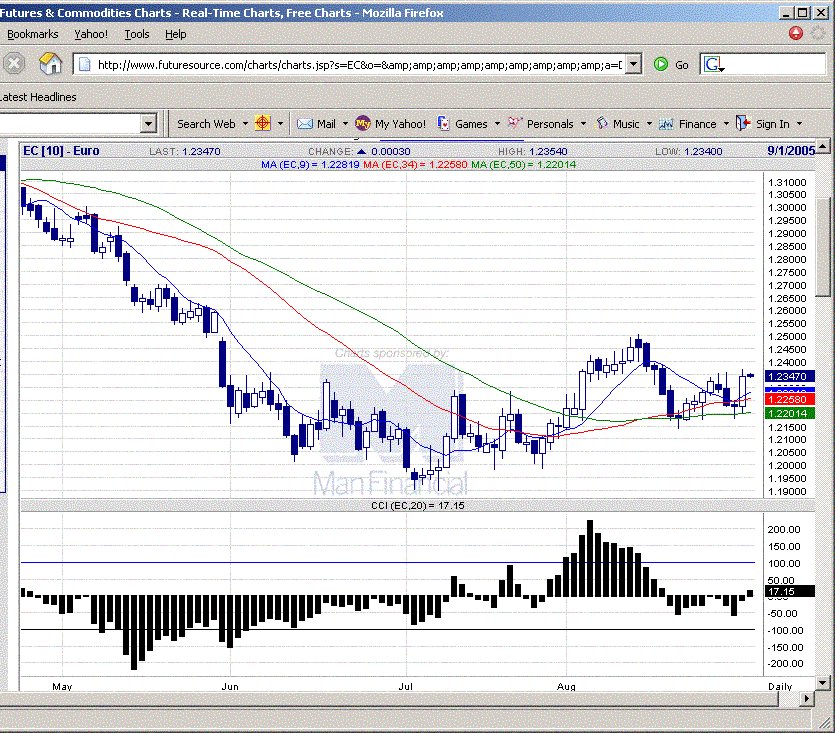
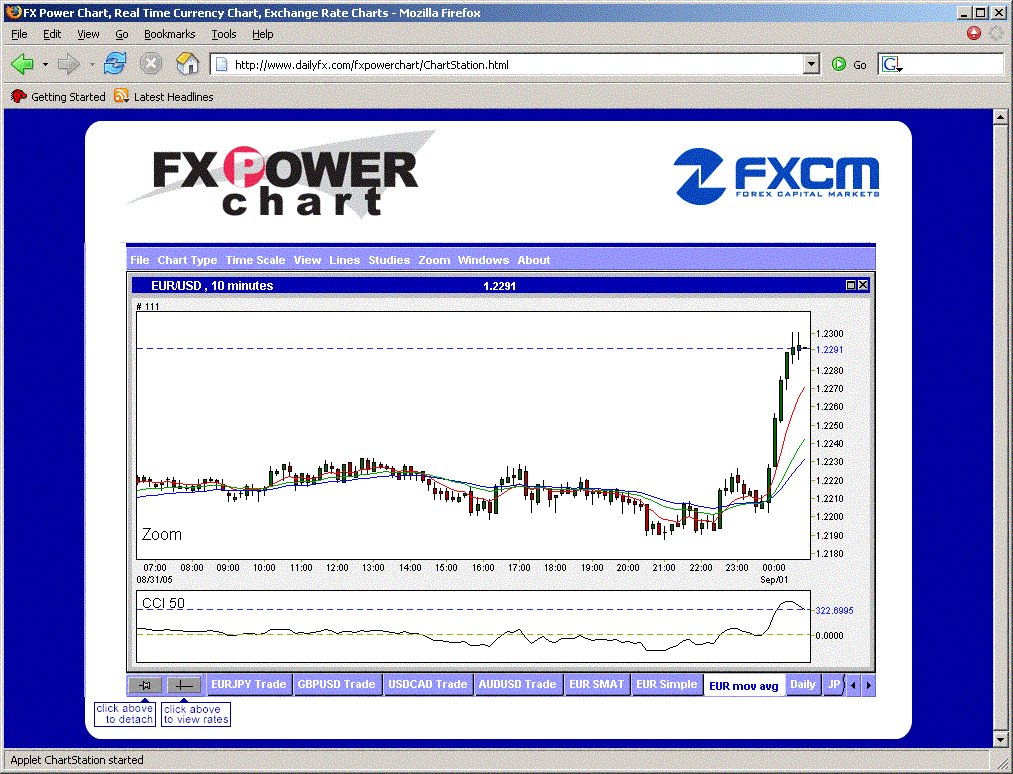
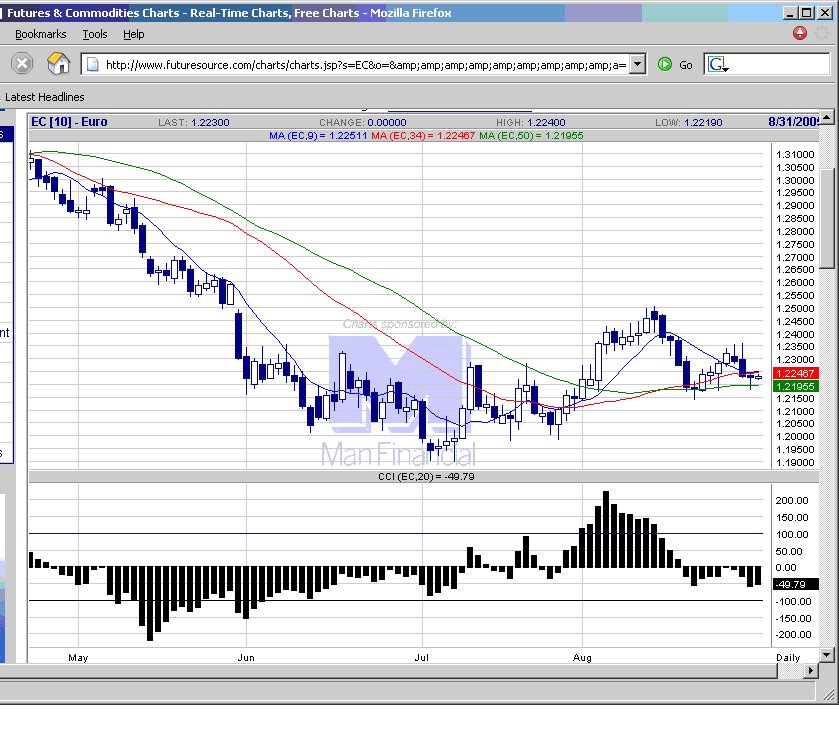
20050831 Daily chart. Above the moving average, big buing interest candlestick.
 EURUSD chart
USDJPY chart
GBPUSD chart
USDCHF chart
posted by emacro @ 8:16 PM
![]()
![]()
Chronicle of the biggest, deepest and most liquid market in the world, the Eurofx market, traded on interbank spot forex market as Eur/Usd and on IMM as the Eurofx futures. Patterns include CCI patterns ZLR etc. IMPORTANT notice: Nothing in this website constitute any advice to buy or sell financial instruments. The contents of this website are for EDUCATIONAL purposes and should not be construed to constitute investment advice. Charts will be from FXCM Power Charts.
EURUSD chart
posted by emacro @ 8:16 PM
![]()
![]()
 EURUSD chart
posted by emacro @ 10:54 AM
![]()
![]()
 EURUSD chart
posted by emacro @ 9:39 PM
![]()
![]()
 EURUSD chart
posted by emacro @ 9:36 PM
![]()
![]()
 EURUSD chart
posted by emacro @ 6:04 AM
![]()
![]()
posted by emacro @ 8:31 PM
![]()
![]()
 EURUSD chart
posted by emacro @ 8:02 PM
![]()
![]()
 EURUSD chart
posted by emacro @ 10:51 PM
![]()
![]()
 EURUSD chart
posted by emacro @ 9:18 PM
![]()
![]()
 EURUSD chart
posted by emacro @ 4:13 AM
![]()
![]()
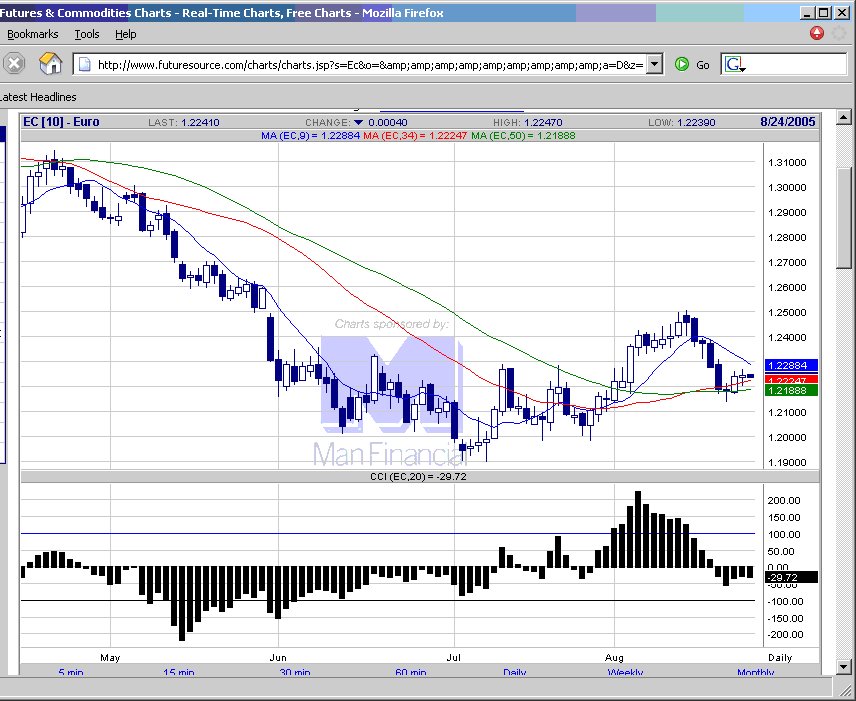
20050824 Closed just below moving averages, which are scrunching together.
 EURUSD chart
posted by emacro @ 9:23 PM
![]()
![]()
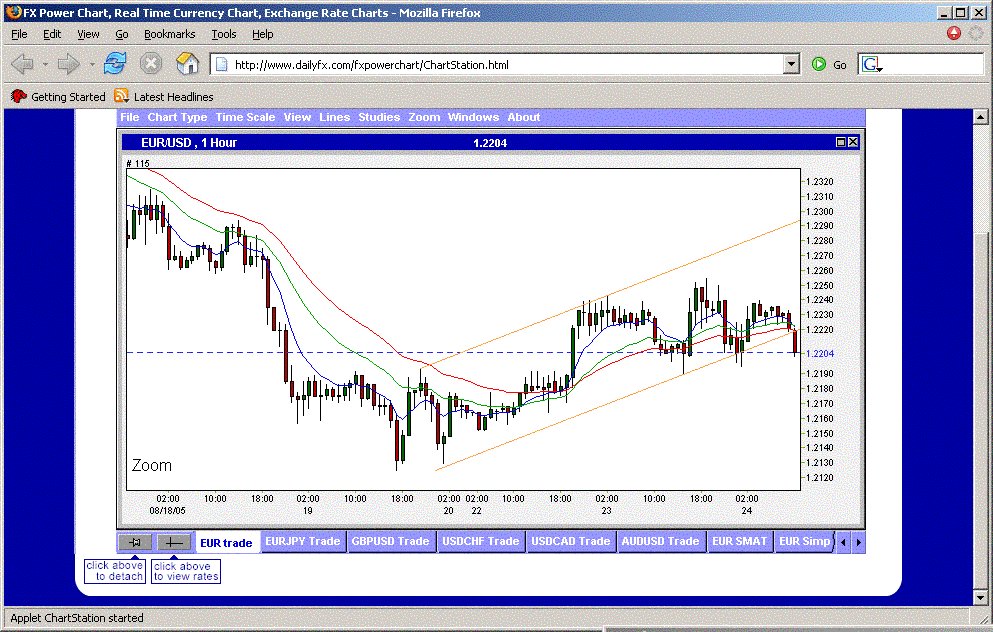
20050824 2:47 am ET. Break turns out to be a good one. Maybe got a chance to scalp short if the eur futures moves back to the moving averages on the durable goods data out today.
 EURUSD chart
posted by emacro @ 2:47 AM
![]()
![]()
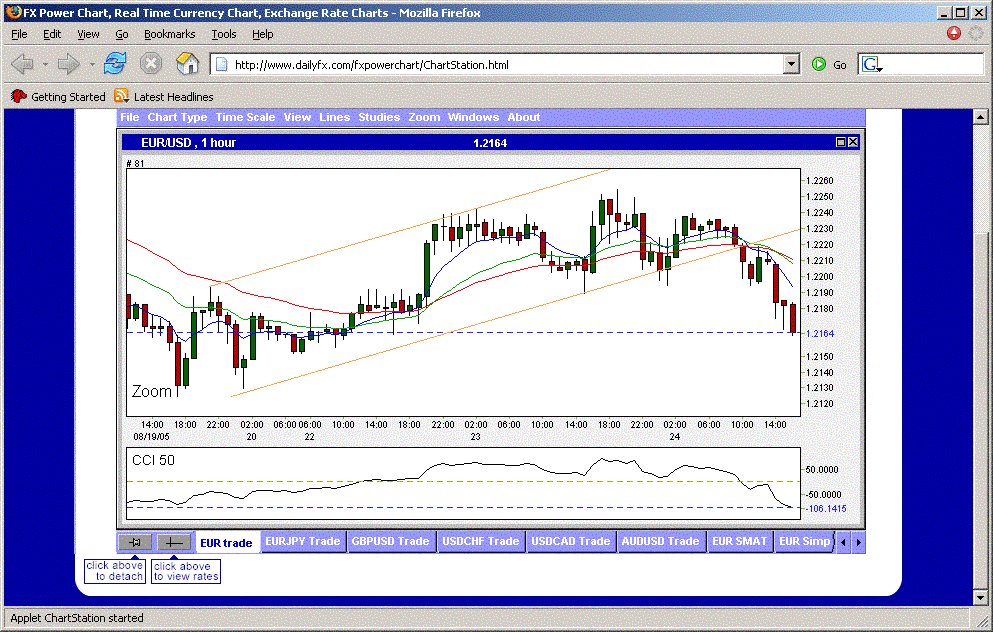
20050824 8:42 pm ET. Break of the previously tested uptrend channel line, points to a short trade for continuation of the move down.
 EURUSD chart
posted by emacro @ 8:45 PM
![]()
![]()
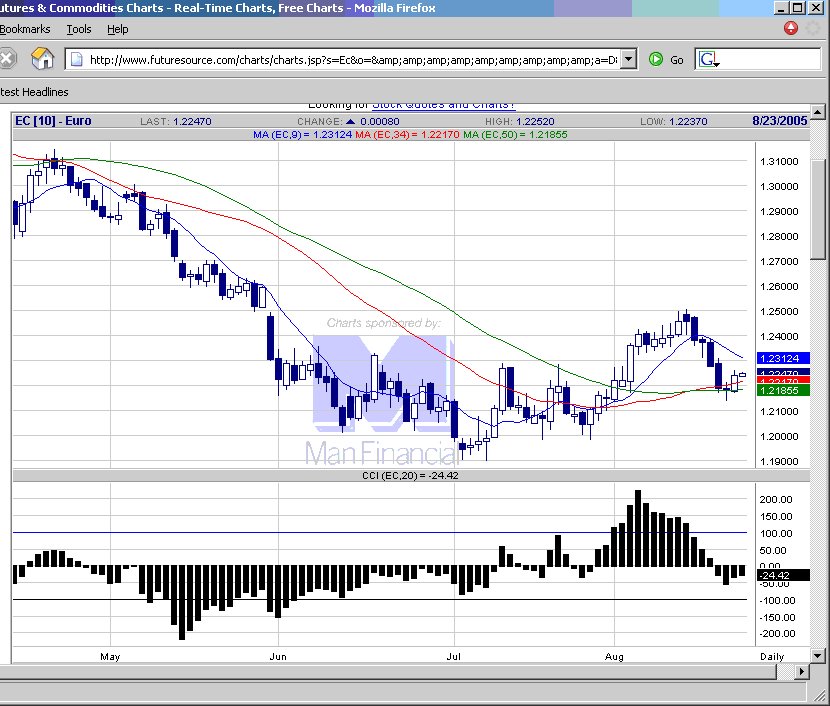
20050823 A doji candlestick, pausing before the next move.
 EURUSD chart
posted by emacro @ 7:33 PM
![]()
![]()
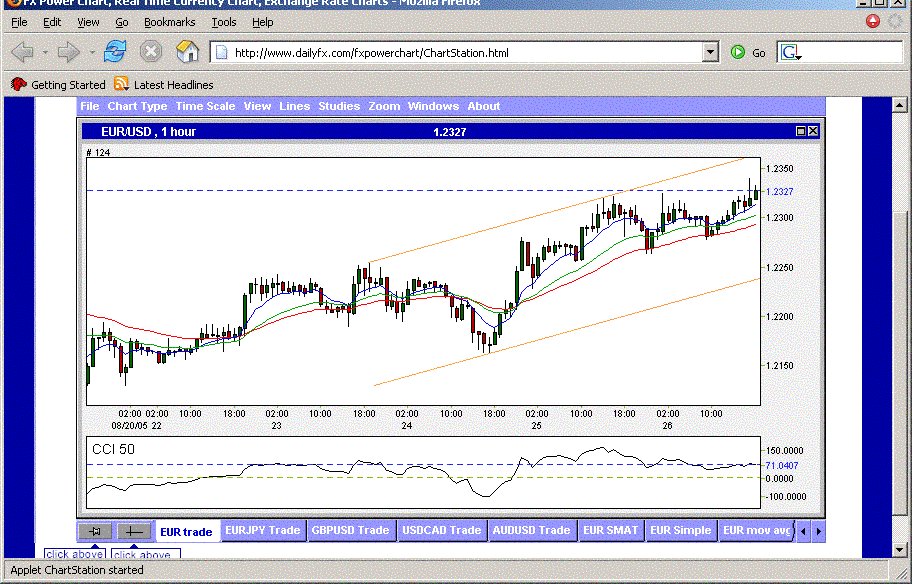
20050822 Big candlestick indicates buying. The expected rebound from the severe downside move. Would be looking for shorts 1.2300-1.2310 level for retest of the lows going forward.
 EURUSD chart
posted by emacro @ 7:52 PM
![]()
![]()
20050818 Euro futures touched the moving average support, providing support, but CCI crosses zero.
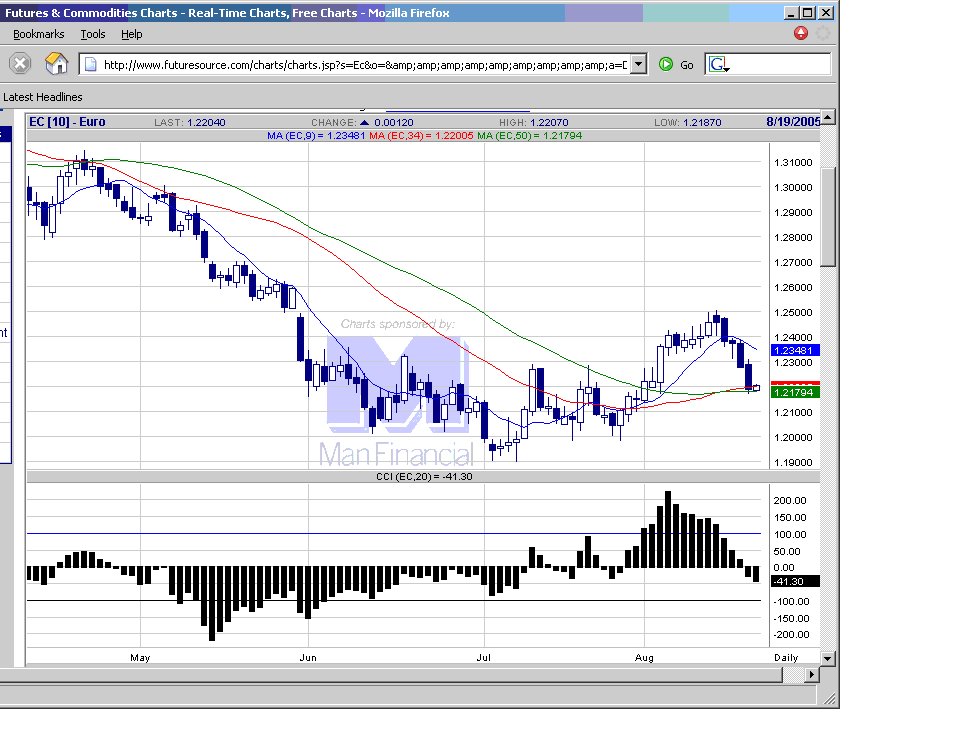 EURUSD chart
posted by emacro @ 8:51 PM
![]()
![]()
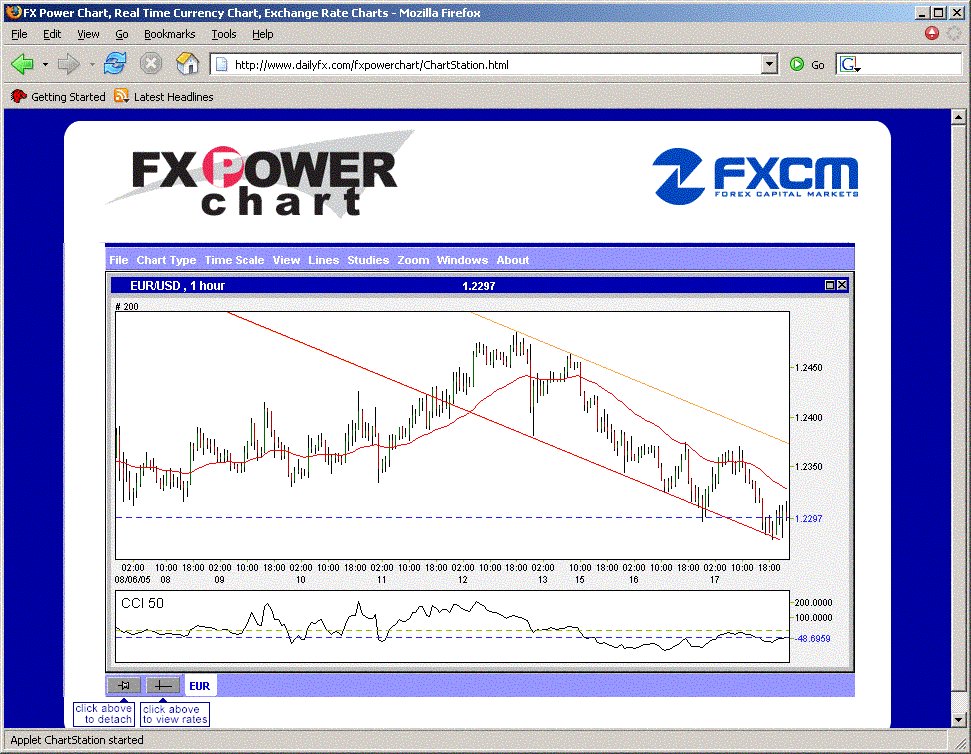
2005088 8:07 pm ET. Eurusd broke the lower channel support. Looks like downtrend could resume. Eur futures though did make a small bounce off the 1.2177 level symmetry support for abut 20 ticks.
 EURUSD chart
posted by emacro @ 8:10 PM
![]()
![]()
20050817 Support beckons at 1.2177 on eur futures.
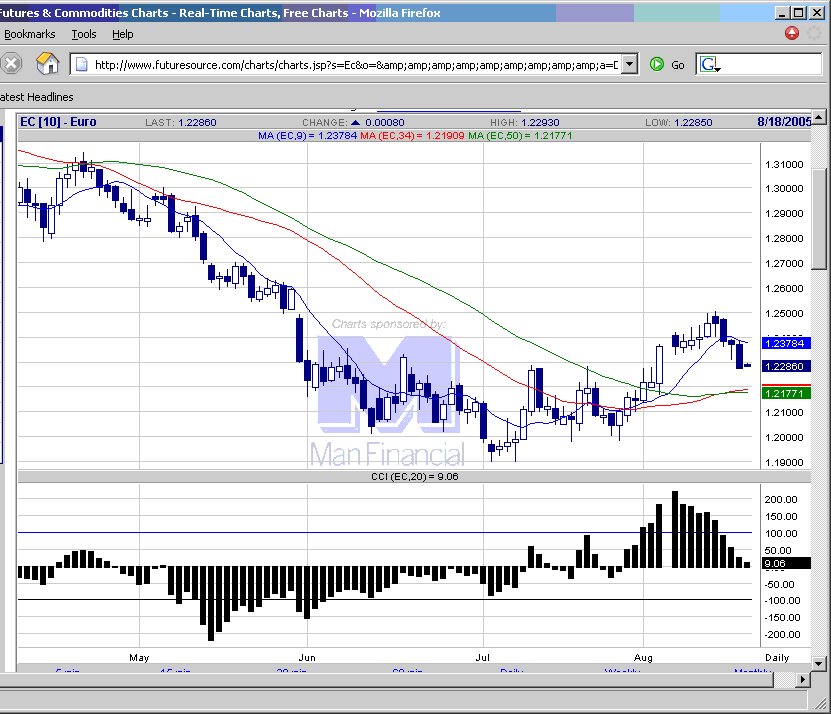 EURUSD chart
posted by emacro @ 7:55 PM
![]()
![]()
20050817 9:40 am ET. OK, got new trend channel for reference now, wtiting for next trade setup.
 EURUSD chart
posted by emacro @ 9:44 AM
![]()
![]()
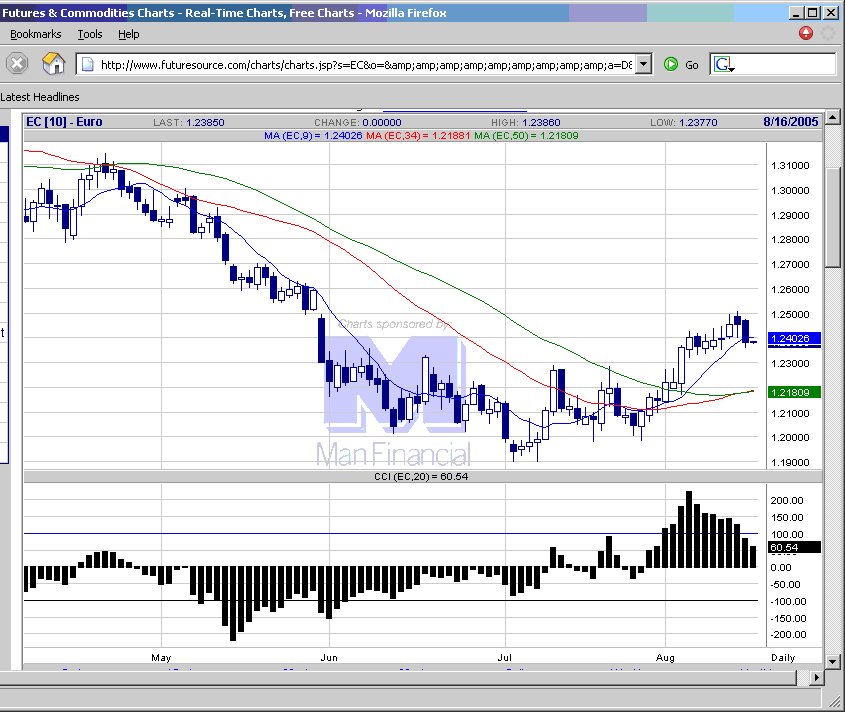
20050816 Bounced right off the symmetry support at 1.2300-10 region.
 EURUSD chart
posted by emacro @ 8:34 PM
![]()
![]()
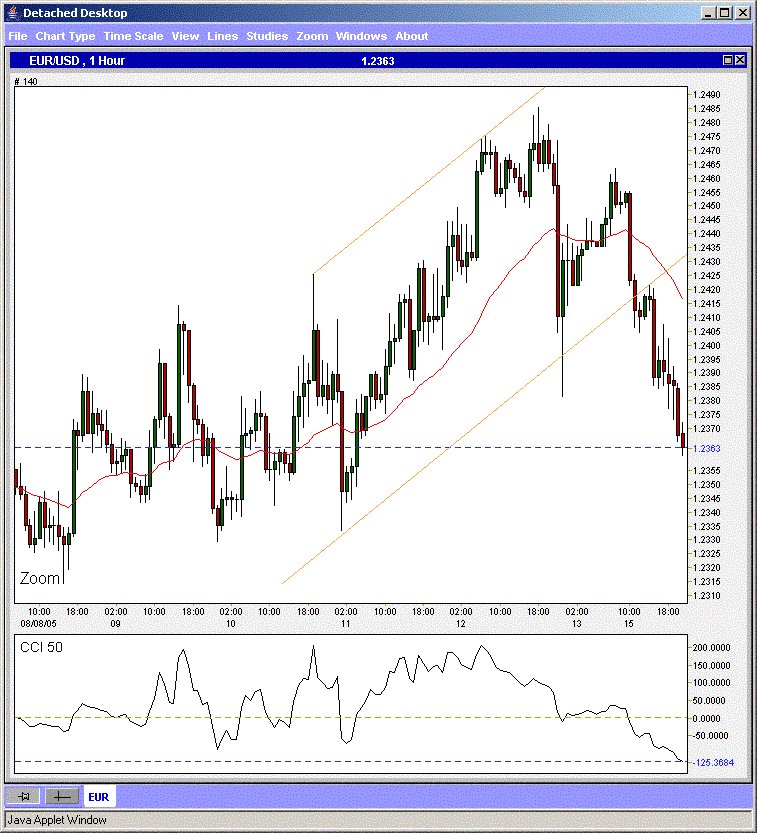
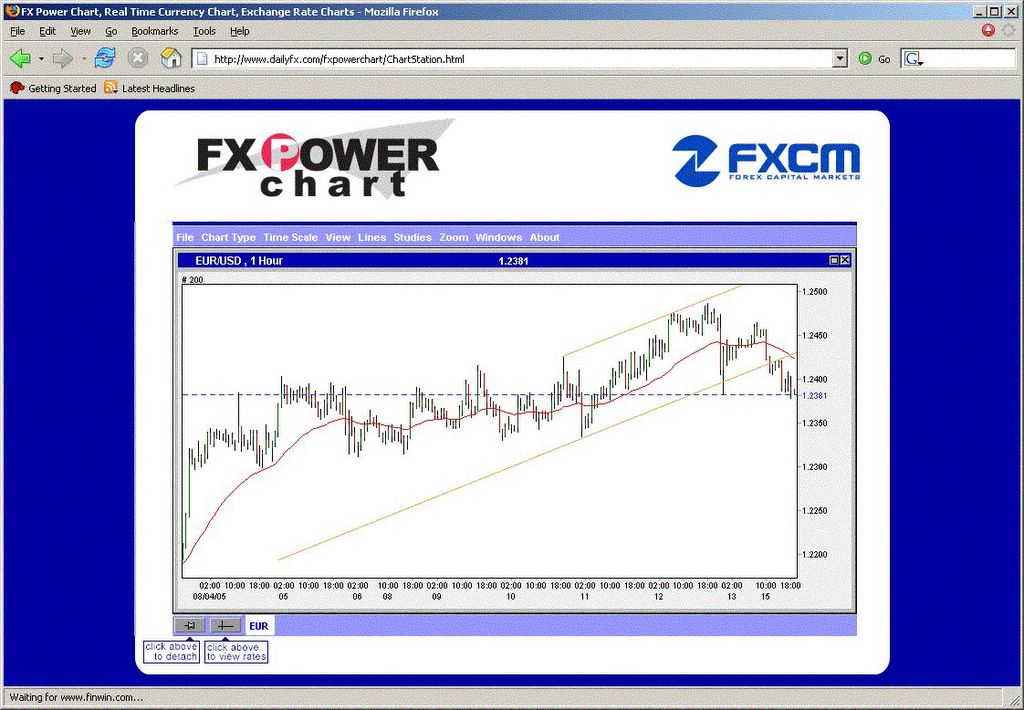
20050815 9:33 pm ET. Continued move to downside from the initial break of trendline.
 EURUSD chart
posted by emacro @ 9:15 PM
![]()
![]()
20050815 Two large black candlestick shows selling interest. 1.2310-20 remains the focus for the uptrend to be intact.
 EURUSD chart
posted by emacro @ 7:53 PM
![]()
![]()
2005085 7:46 am ET. If the break is going to turn out to be good, then a late entry will still yield a tidy profit.
 EURUSD chart
posted by emacro @ 7:51 AM
![]()
![]()
20050815 5:13am ET. A possible short few hours ago when trendline support broke.
 EURUSD chart
posted by emacro @ 5:17 AM
![]()
![]()
20050812 The 1.2400 level proves to be strong, bears driving down to that level after the trade deficit numbers release, but failing to sustain downside, resulting in a cose above the midpint of the candlestick. But the candle still shows some selling, could be attributed to profit taking. Uptrend intact barring take out below 1.2400 on futures.
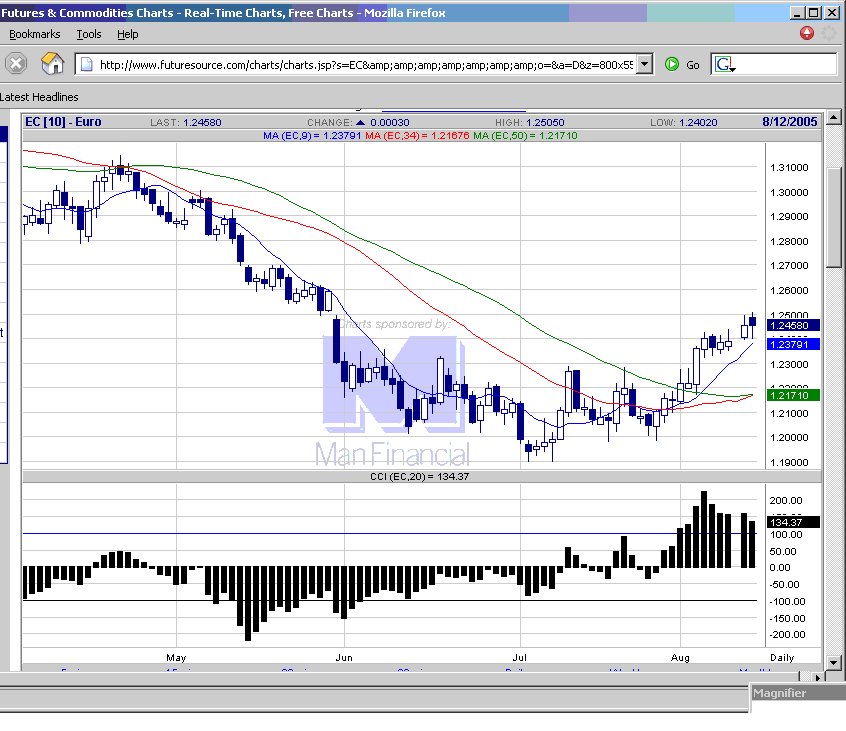 EURUSD chart
posted by emacro @ 9:17 PM
![]()
![]()