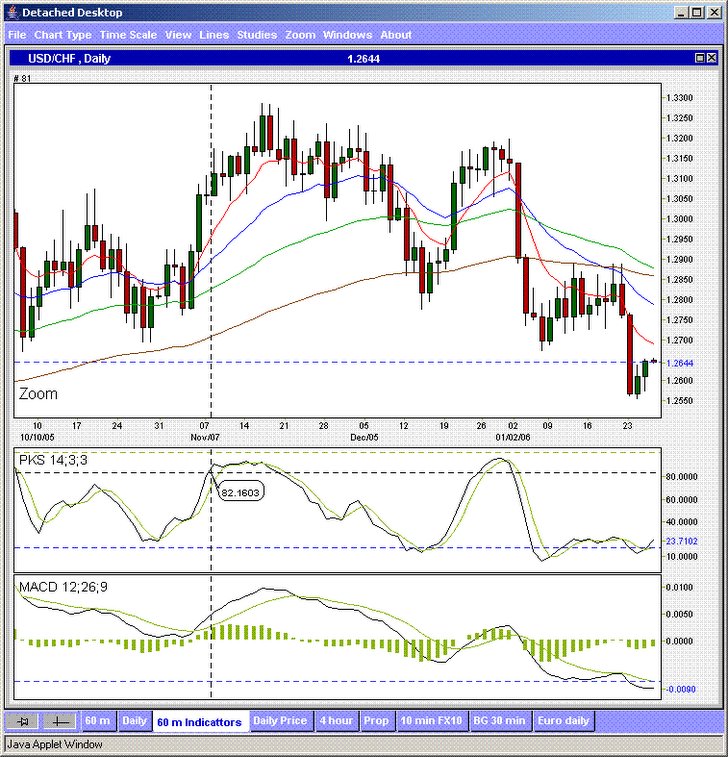
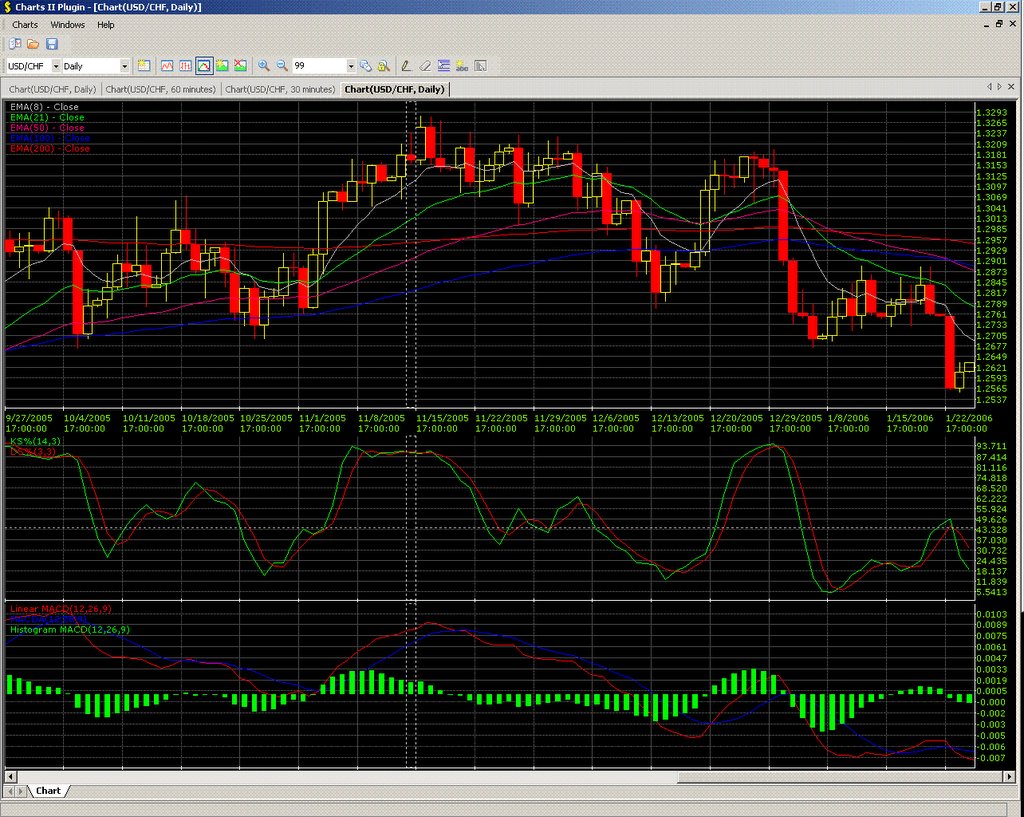
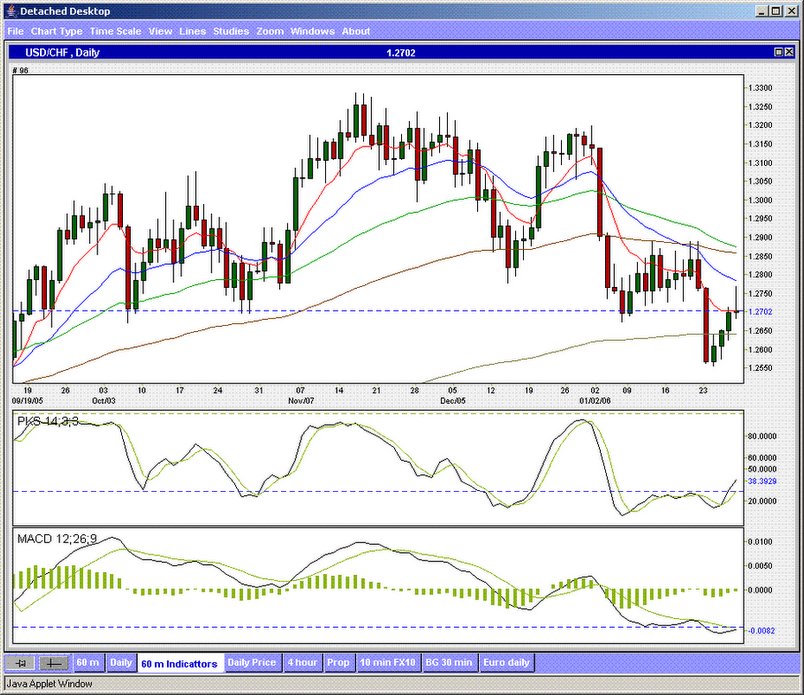
 20060127 9:12 am ET. So we shorted the USDCHF on the way up, with a change of plan. Used the 1.2735 level, which was the 200 day ema. (This was a key level in trend) Took a little heat but the release of the data today( whatever it was) caused the intraday reversal for a little floating profit in favour of the position. Let's see how it goes holding this longer term position.
  EURUSD chart
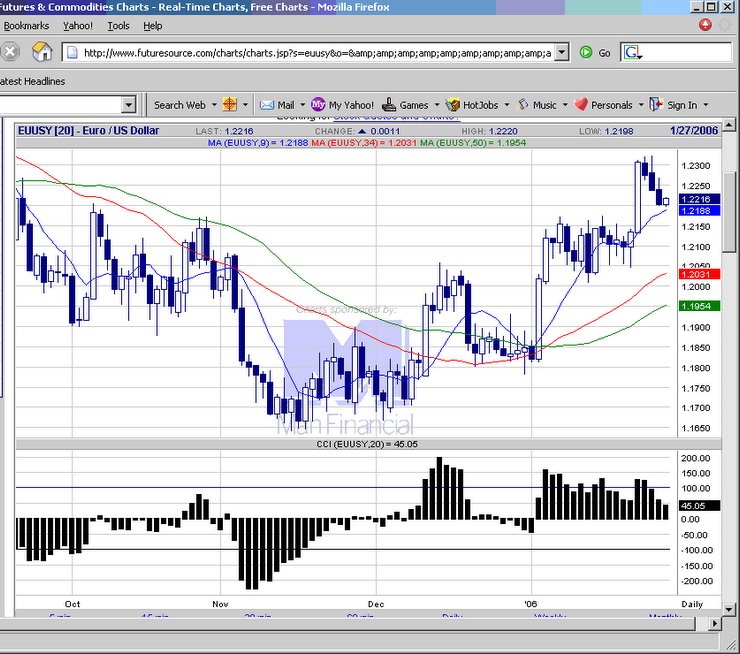
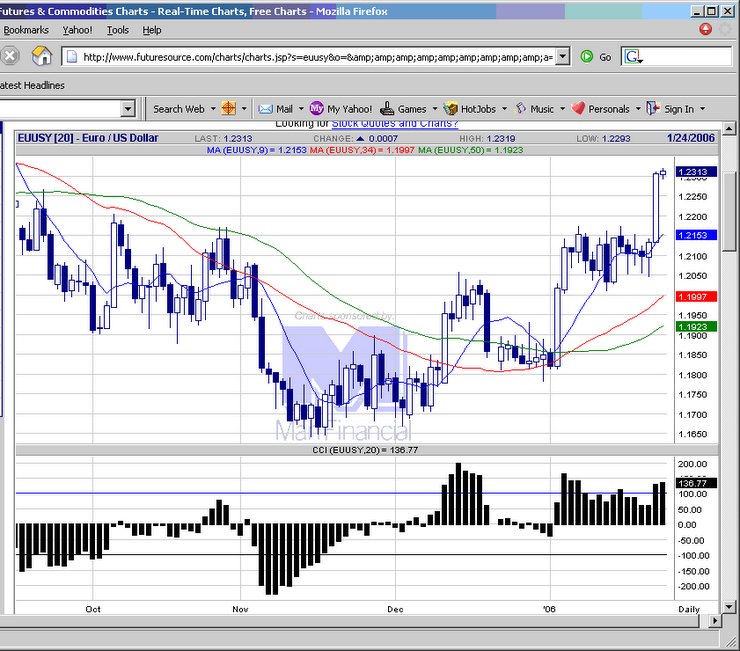
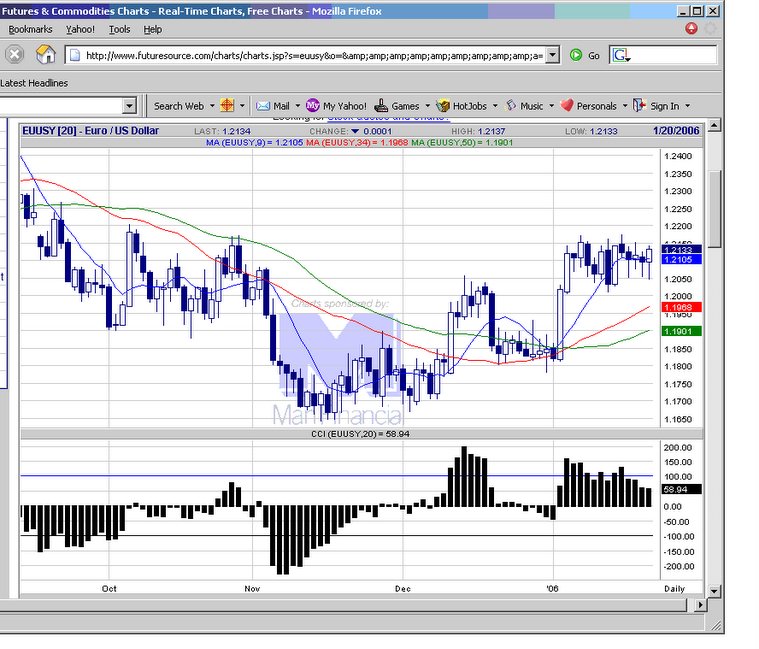
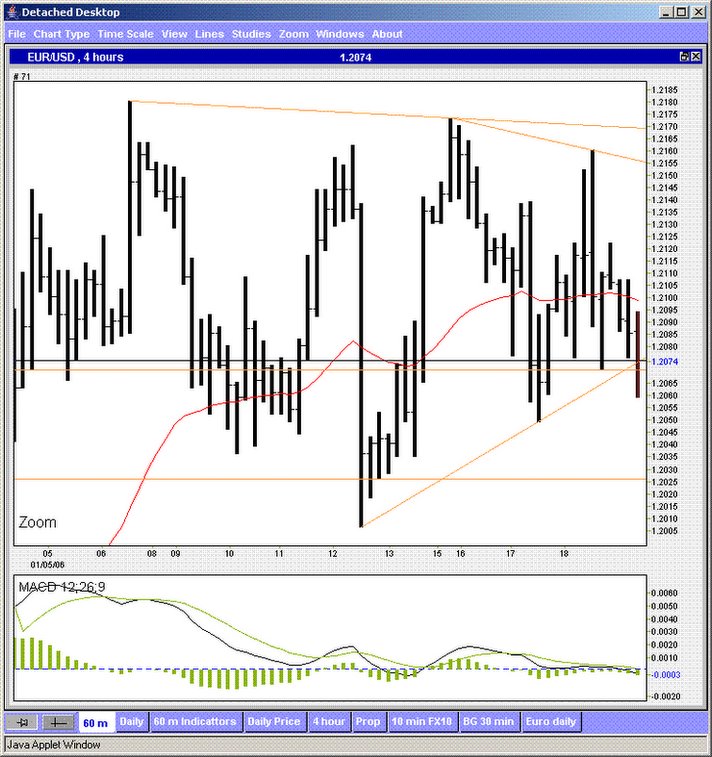
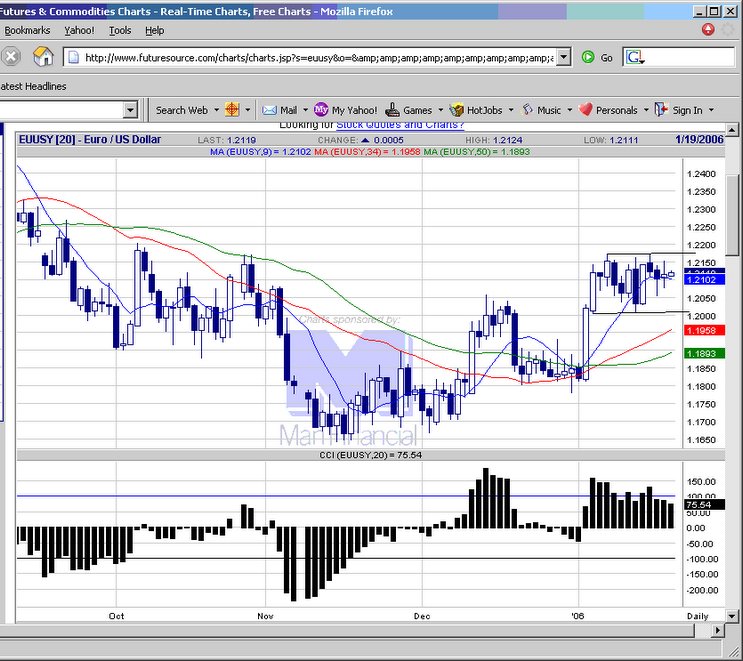
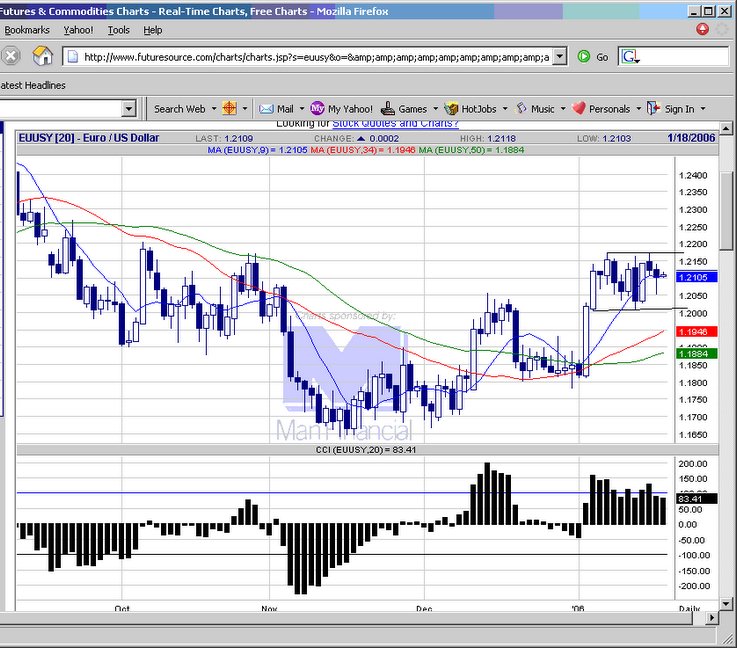
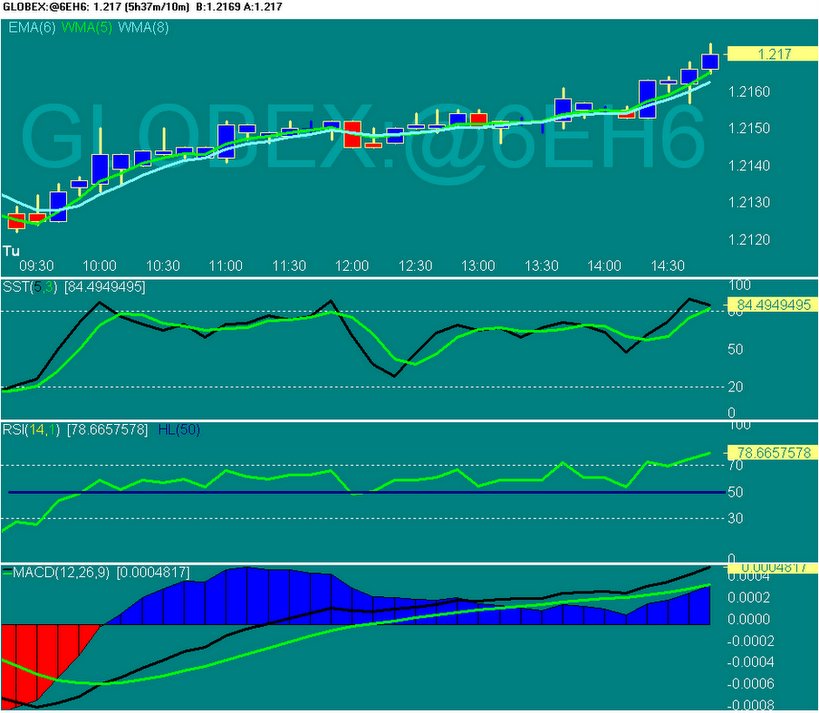
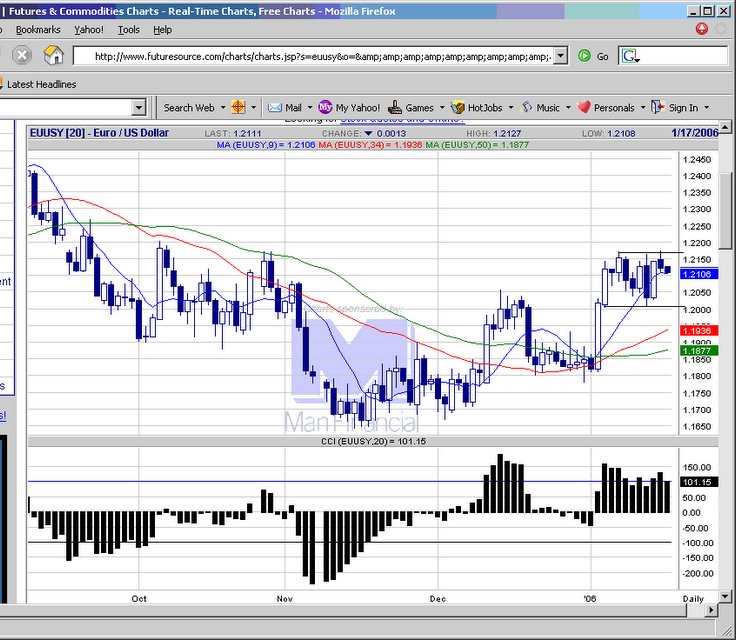
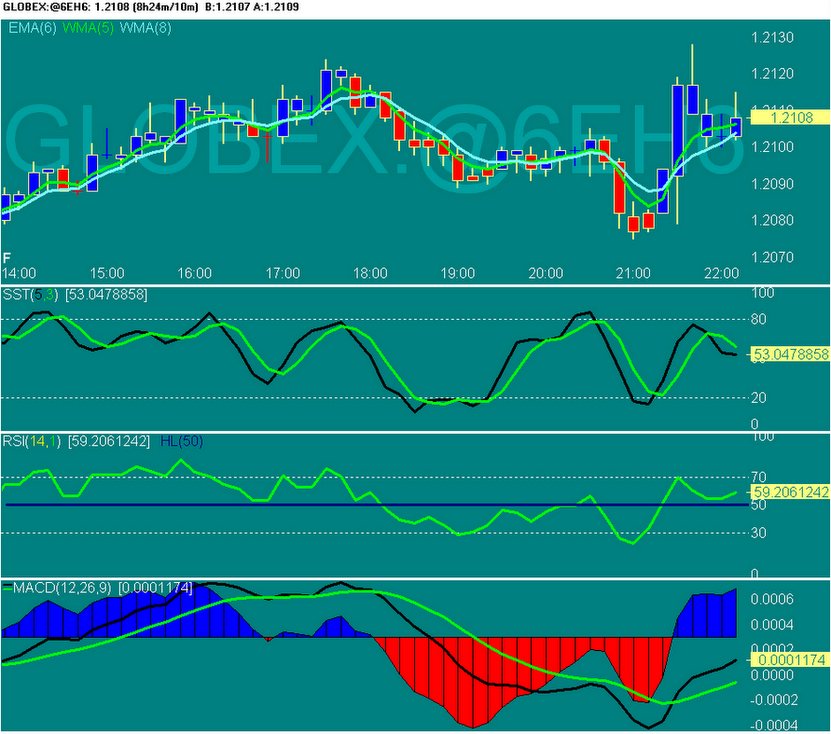
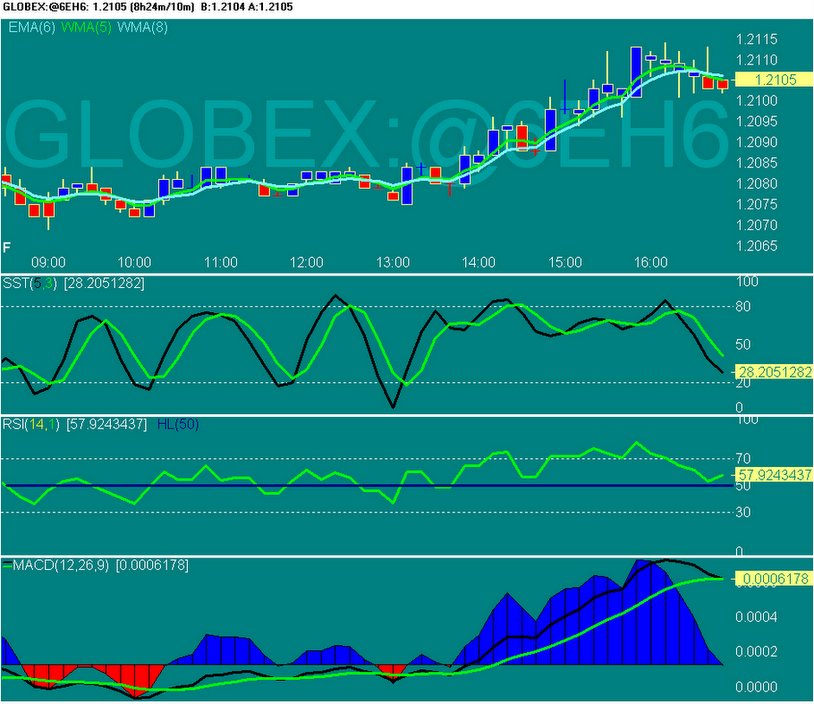
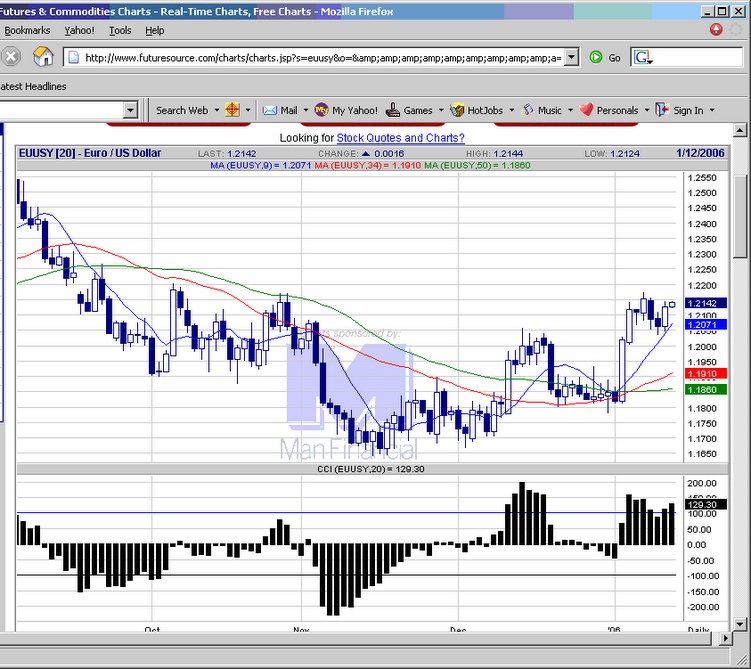
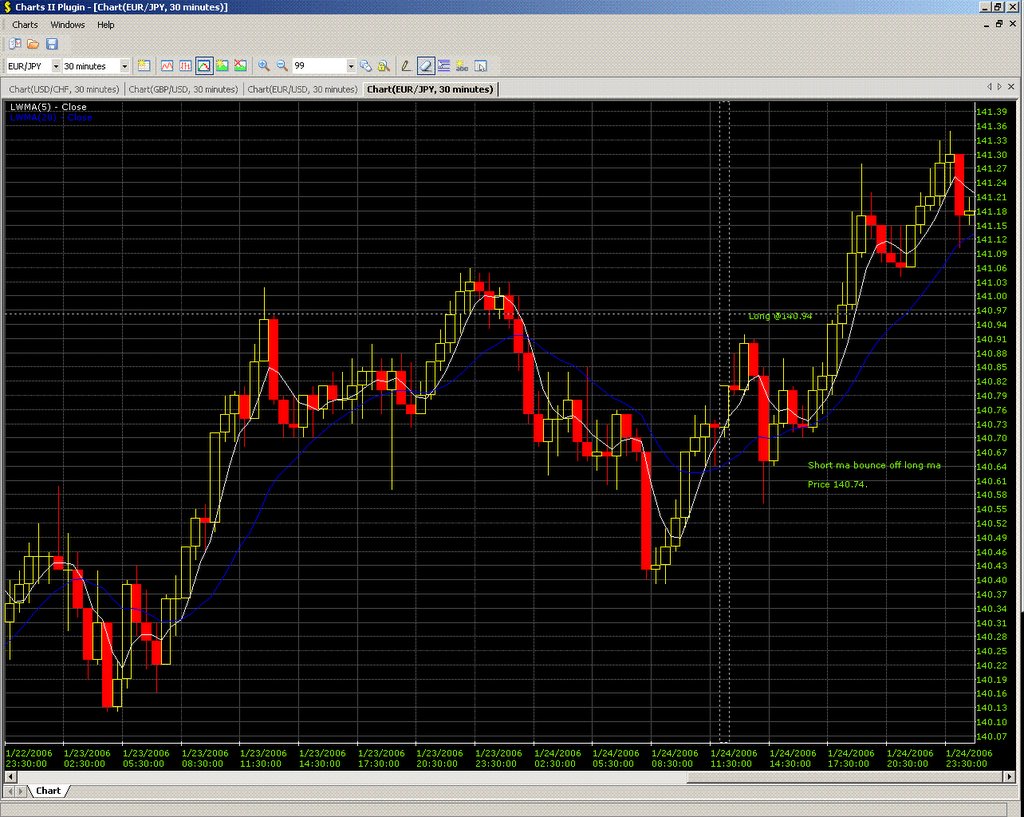
USDJPY chart
GBPUSD chart
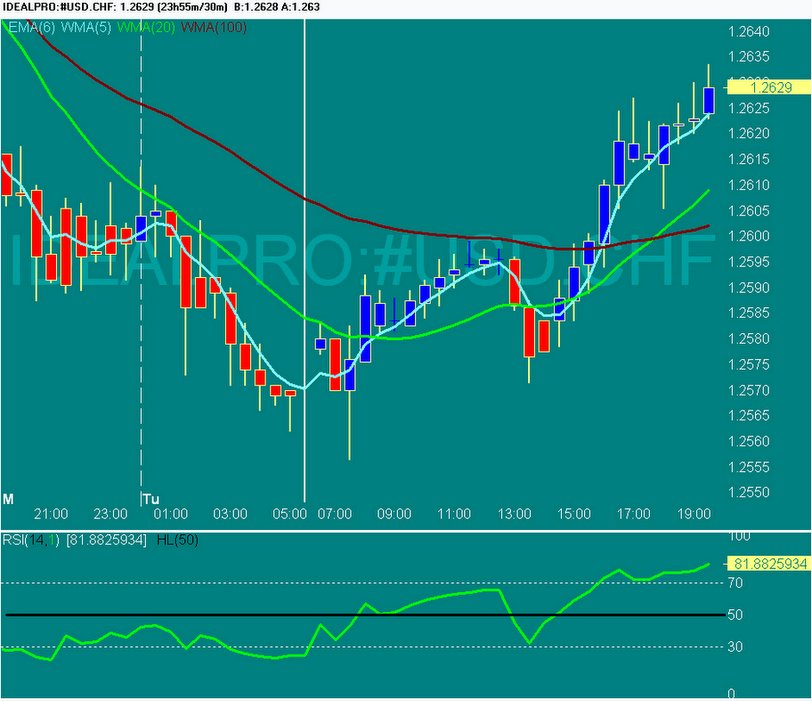
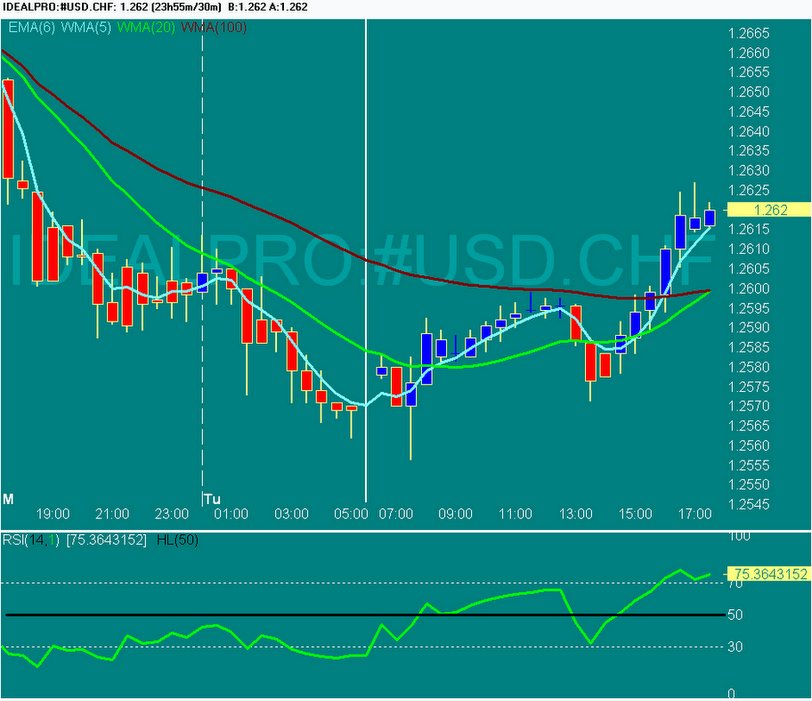
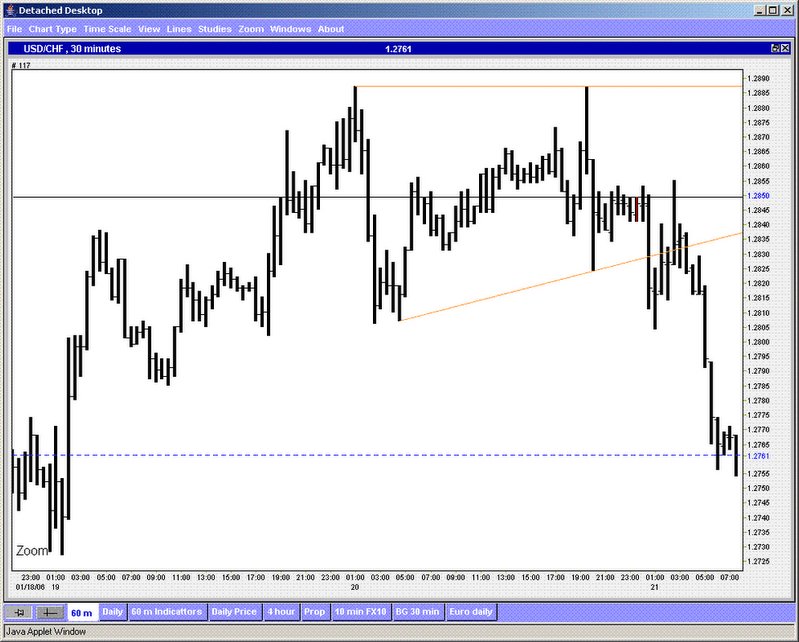
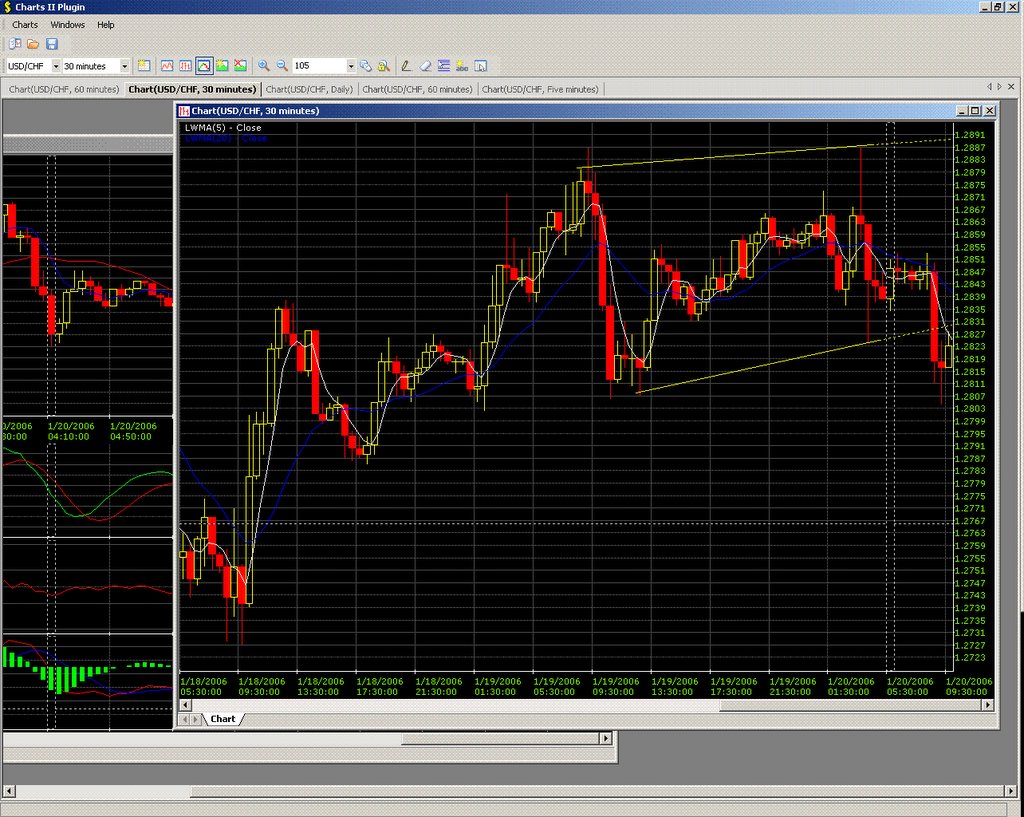
USDCHF chart
posted by emacro @ 9:19 AM
![]()
![]()