Wednesday, June 29, 2005

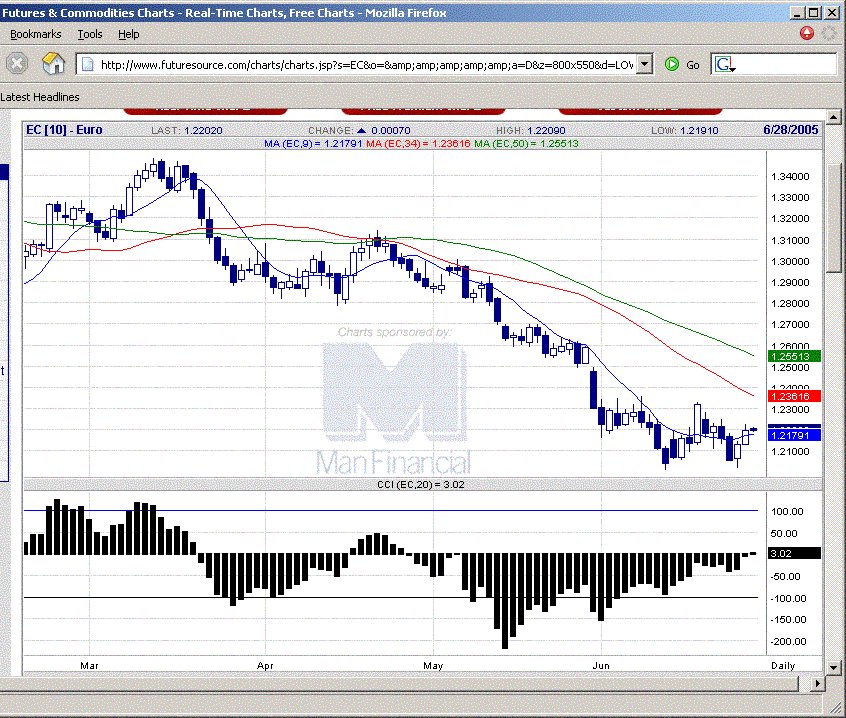
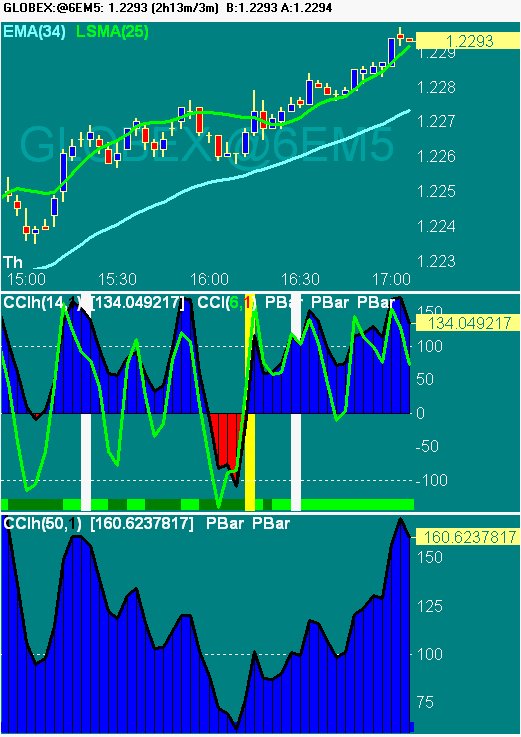
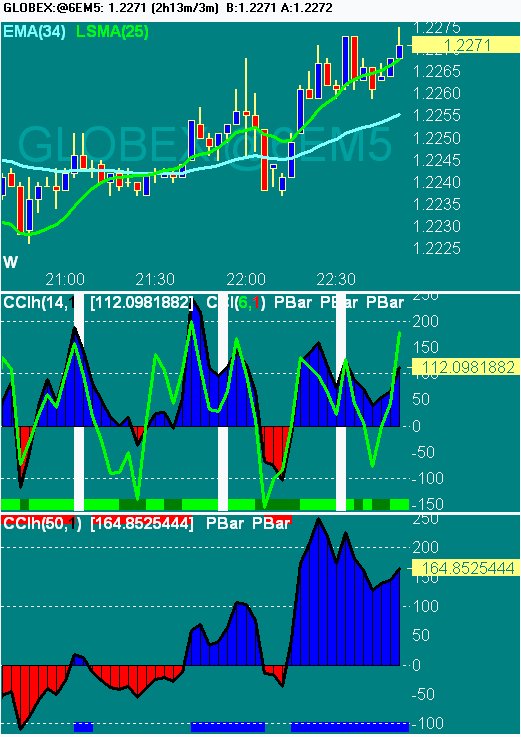
20050629 Sideways action, forming a triangle pattern with lower highs nd higher lows. Could well break out either side. Downside break will trigger stop loss of long psition and upside break could see 1.23 taken out.
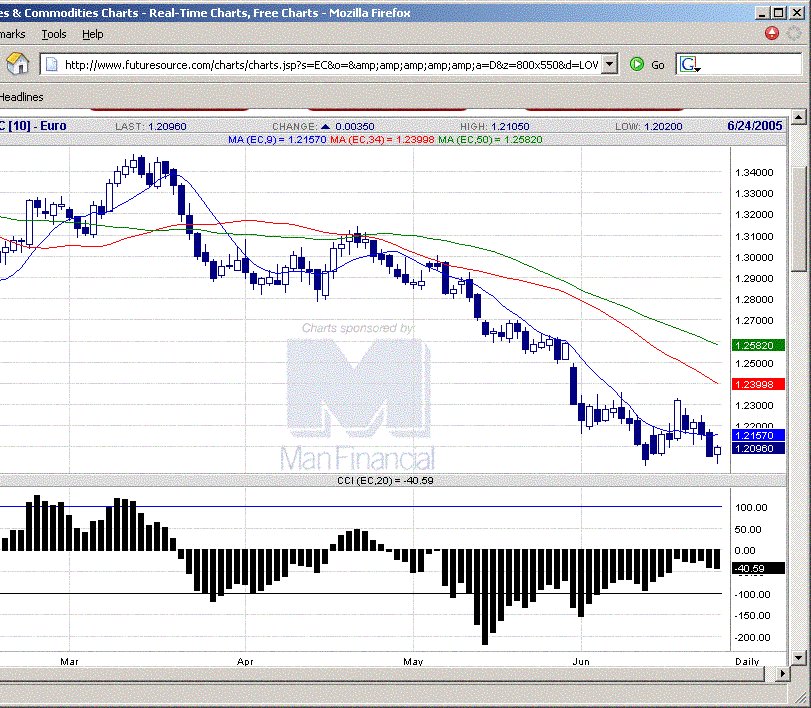
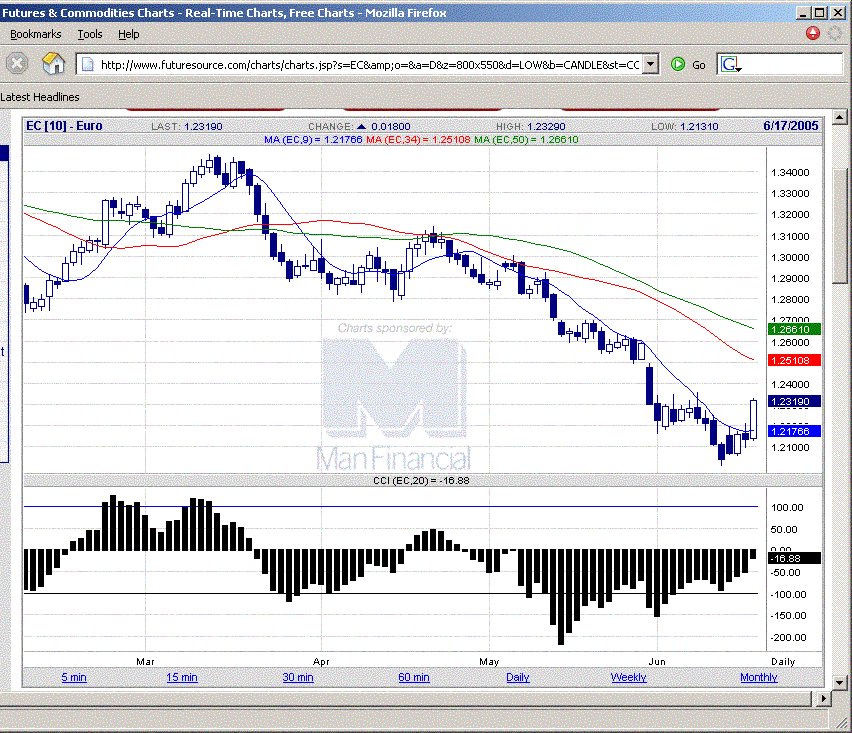
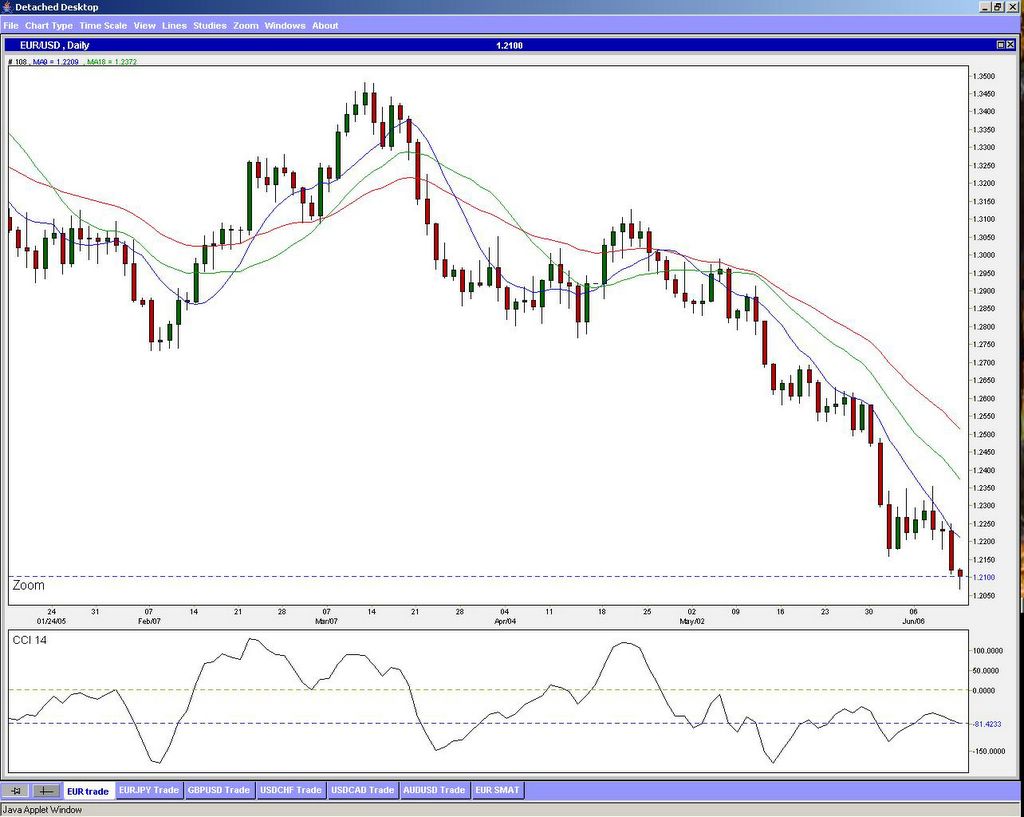
 Posted by Hello

EURUSD chart
USDJPY chart
GBPUSD chart
USDCHF chart

Tuesday, June 28, 2005

20050628 Close below 1.21 not looking good for the target

EURUSD chart
USDJPY chart
GBPUSD chart
USDCHF chart

Monday, June 27, 2005

20050627 Into the 3rd day of rebound since the double bottom panned out. Yet to reach the 1.23-1.2400 on the cash market though. Posted by Hello

EURUSD chart
USDJPY chart
GBPUSD chart
USDCHF chart

Friday, June 24, 2005

20050624 The chart pttern looks like double bottom forming. If it holds, the atrget of 1.2400 (now looking not good) may pan out. Analysts and traders are now saying "The Euro has a date with destiny to reach 1.2000", dog piling into the short trade at these levels do not give good return. They are 90% wrong with what they say, just like when eurusd was at 1.2900, the big 3, Merrill, UBS and Deutsche, supposedly the biggest 3 fx trading houses all were calling for "Euro will reassert the bull" Posted by Hello

EURUSD chart
USDJPY chart
GBPUSD chart
USDCHF chart

Sunday, June 19, 2005

20050617 Eurofx futures chart. Buy ignal working out well. In act even as late as Thursday, opportunity exists to enter the trade. Target 1.2300 to 1.2400 on the EURUSD cash still intct. Posted by Hello

EURUSD chart
USDJPY chart
GBPUSD chart
USDCHF chart

Friday, June 17, 2005

20050617 The move did eventuate to around 1.2270. Aple opportunities even up to Thursday of the week to enter the long position, with the latecomers still piling into the shorts of the eurusd. Posted by Hello

EURUSD chart
USDJPY chart
GBPUSD chart
USDCHF chart

Sunday, June 12, 2005

20050613 Since the last long term trading view in April (http://eurofxtrading.blogspot.com/2005_04_01_eurofxtrading_archive.html), now comes another interesting pattern on the EURUSD daily chart. Could point the way for the rebound to the 34 ema 1.2300-1.2400. Reason: the simplest being the triple divergence and the descending wedge pattern on the price chart. Posted by Hello

EURUSD chart
USDJPY chart
GBPUSD chart
USDCHF chart

Thursday, June 02, 2005

20050602 European trade ZLR. Posted by Hello

EURUSD chart
USDJPY chart
GBPUSD chart
USDCHF chart

Wednesday, June 01, 2005

20050601 US trade ZLR, but is patchy trend. Posted by Hello

EURUSD chart
USDJPY chart
GBPUSD chart
USDCHF chart

20050601 European trade ZLR. Posted by Hello

EURUSD chart
USDJPY chart
GBPUSD chart
USDCHF chart