Thursday, April 14, 2005


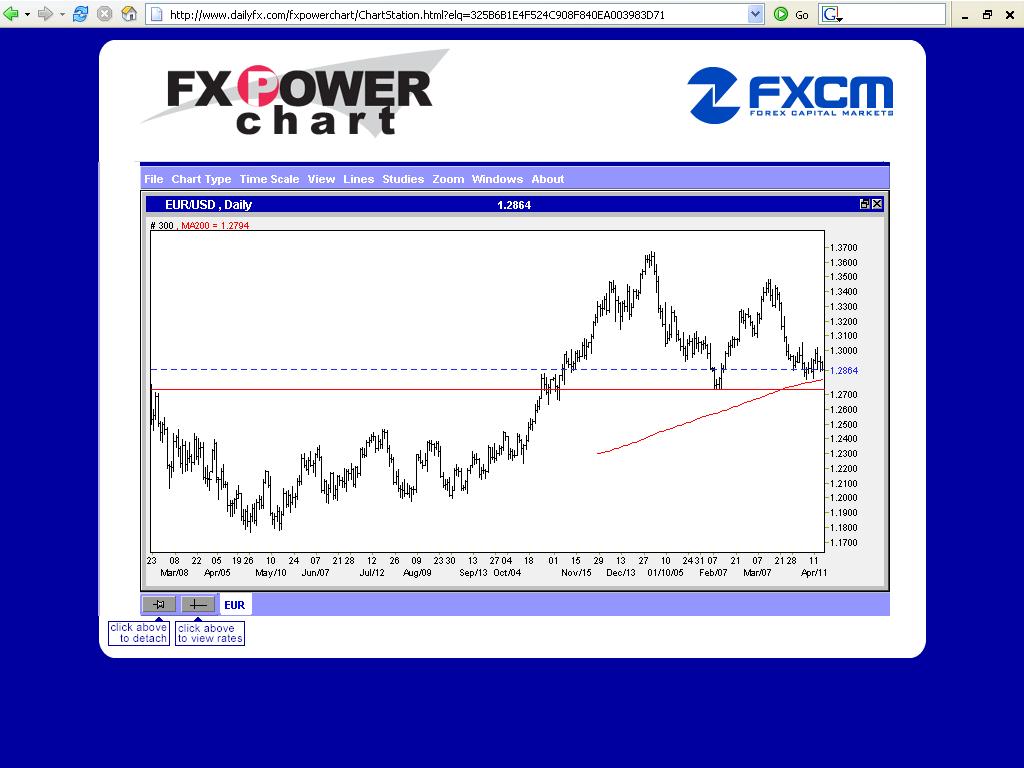
20050414 Daily chart with the 200 day sma shows the market is at the moment of truth. The larger pattern looks like a giant double top, with the neckline around 1.2800. Breaking of the 200 sma and the horizontal trendline, should target 1.2000-1.2100 for the EURUSD. If this scenario plays out, could be a prelude to a major trend reversal, and a start to the USD bull market.
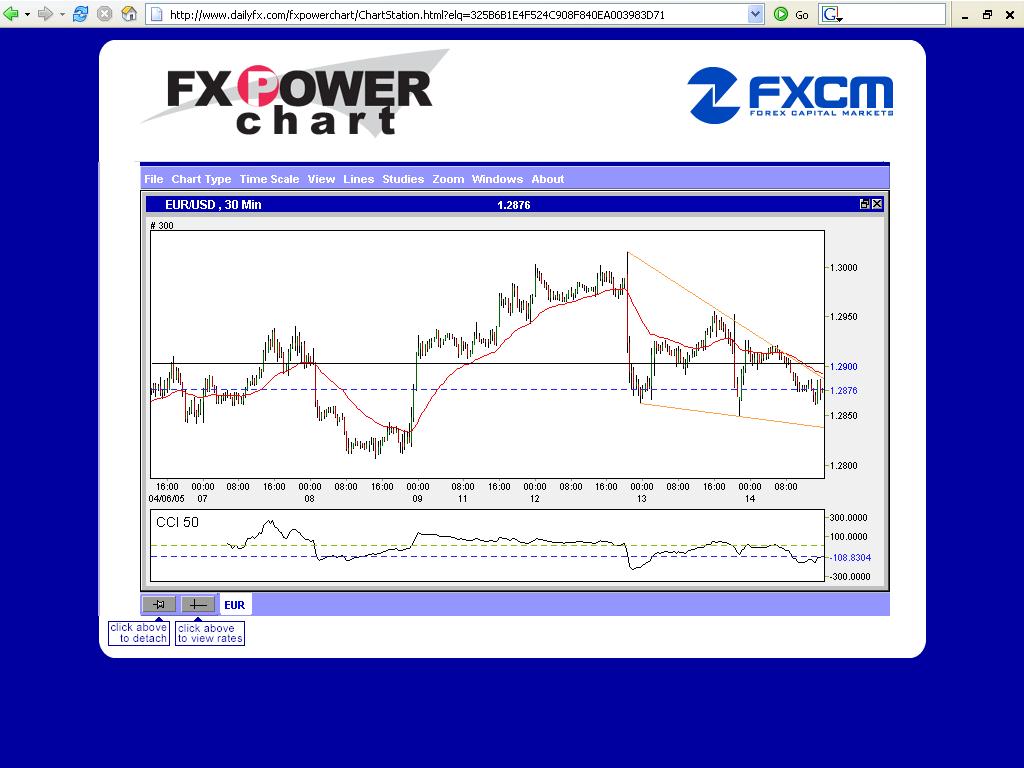
 Posted by Hello

EURUSD chart
USDJPY chart
GBPUSD chart
USDCHF chart


20050414 An interesting wedge pattern developing. Signals break out either side for a pretty substantial move. My bias is for a downside move, although generally wedges break the other way. Posted by Hello

EURUSD chart
USDJPY chart
GBPUSD chart
USDCHF chart

Eurofx trading blog

The fx market is the deepest, most efficient and volatile markets in the world, trading in trillions of dollars every day. This blog will chronicle some possible setups, news, opinions (how they can be sometimes wrong) and possible trading scenarios.

EURUSD chart
USDJPY chart
GBPUSD chart
USDCHF chart