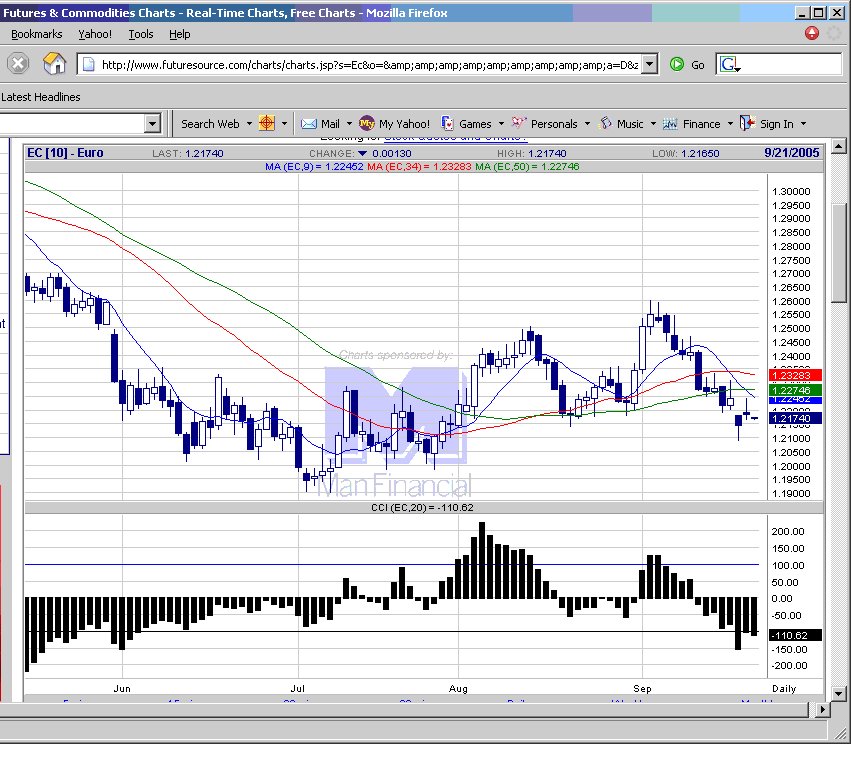
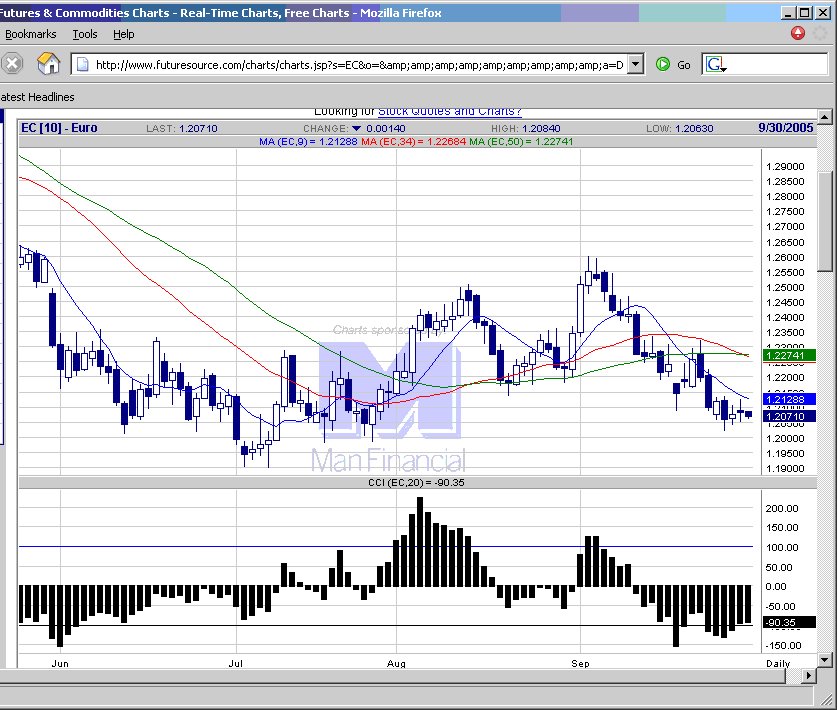
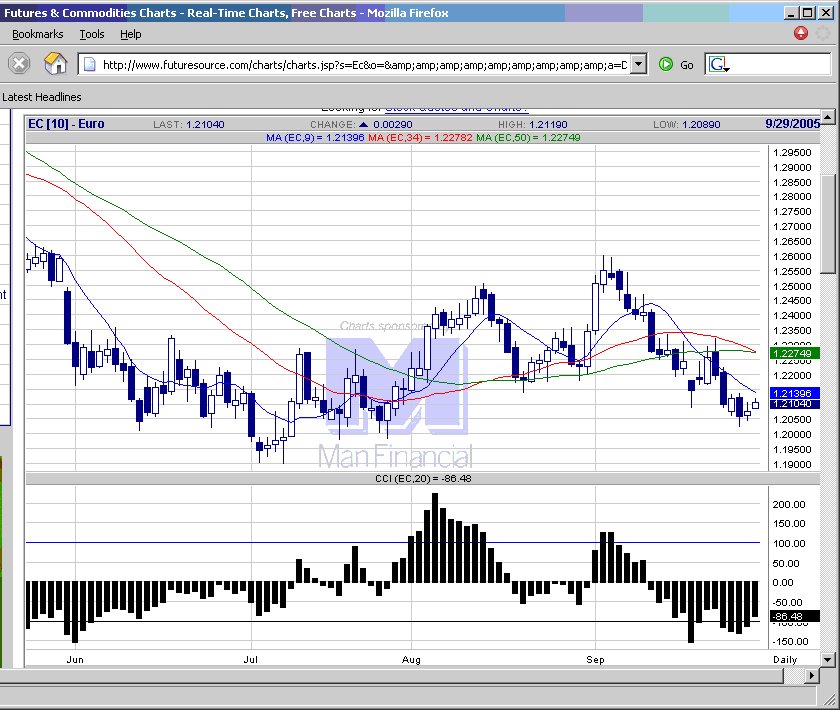
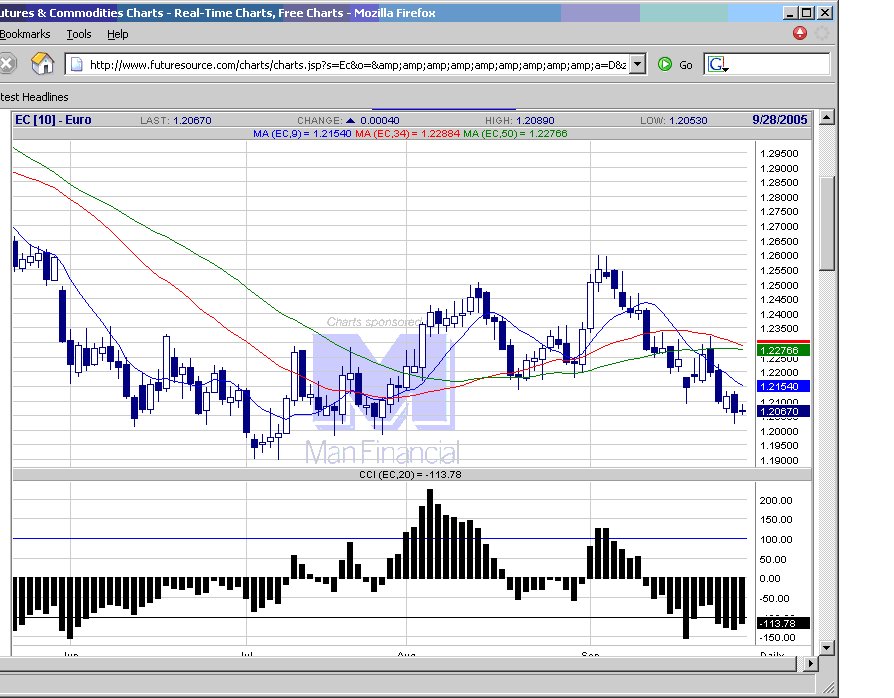
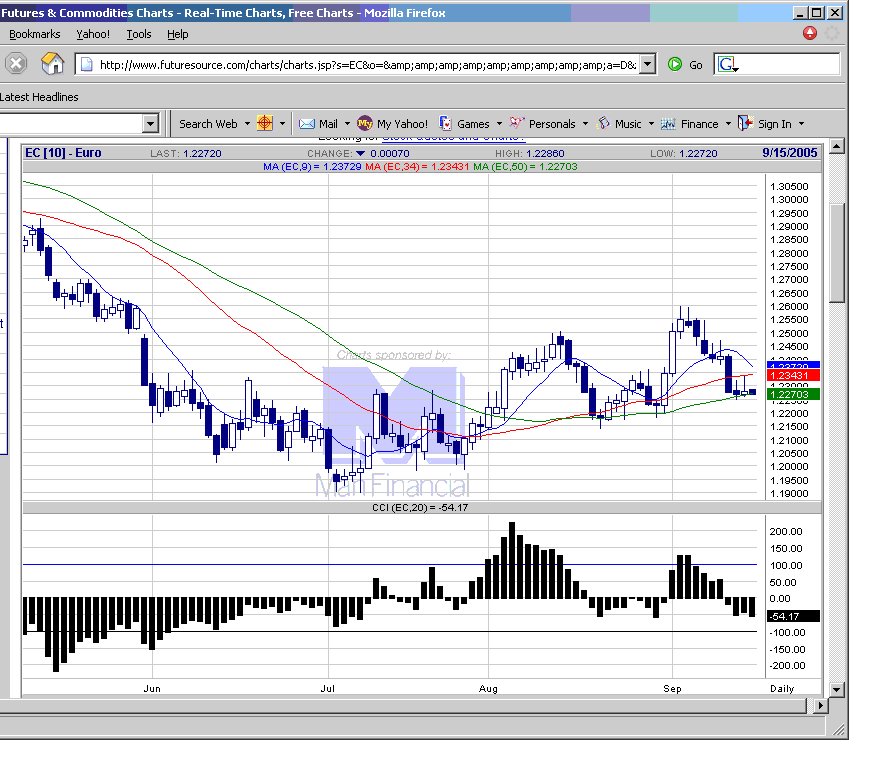
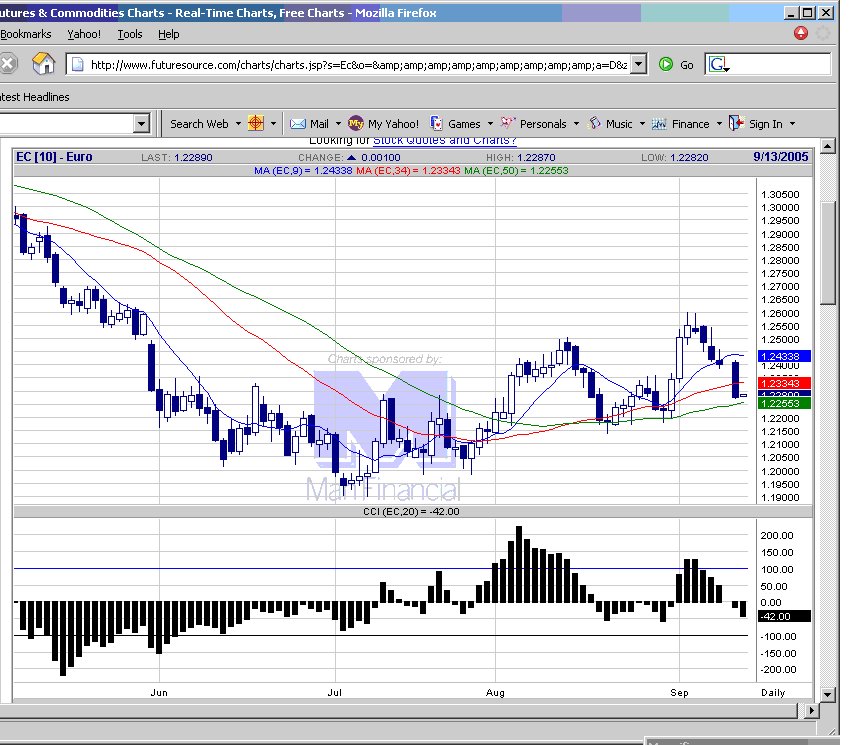
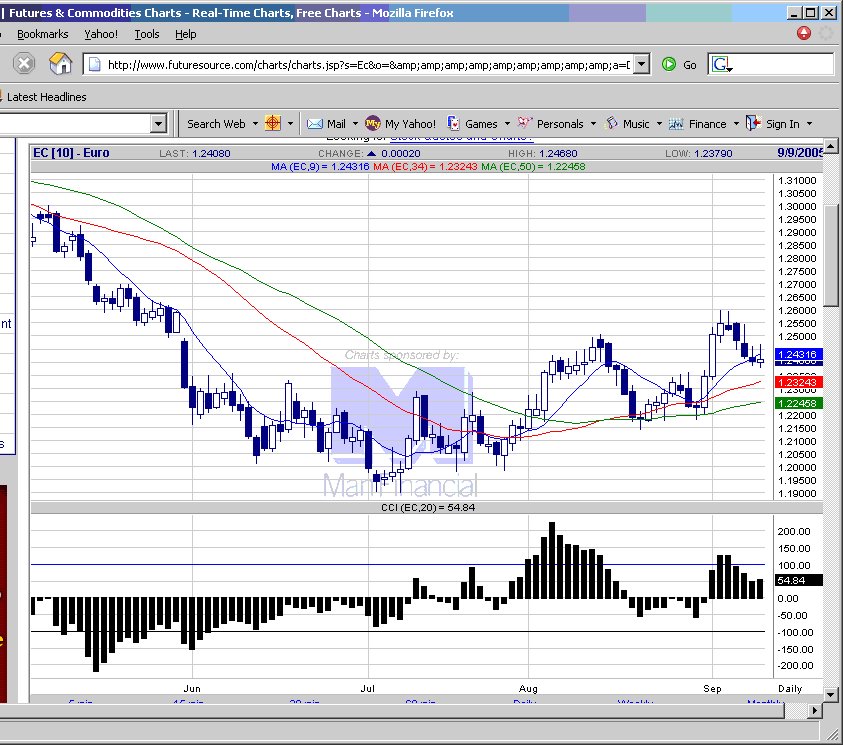
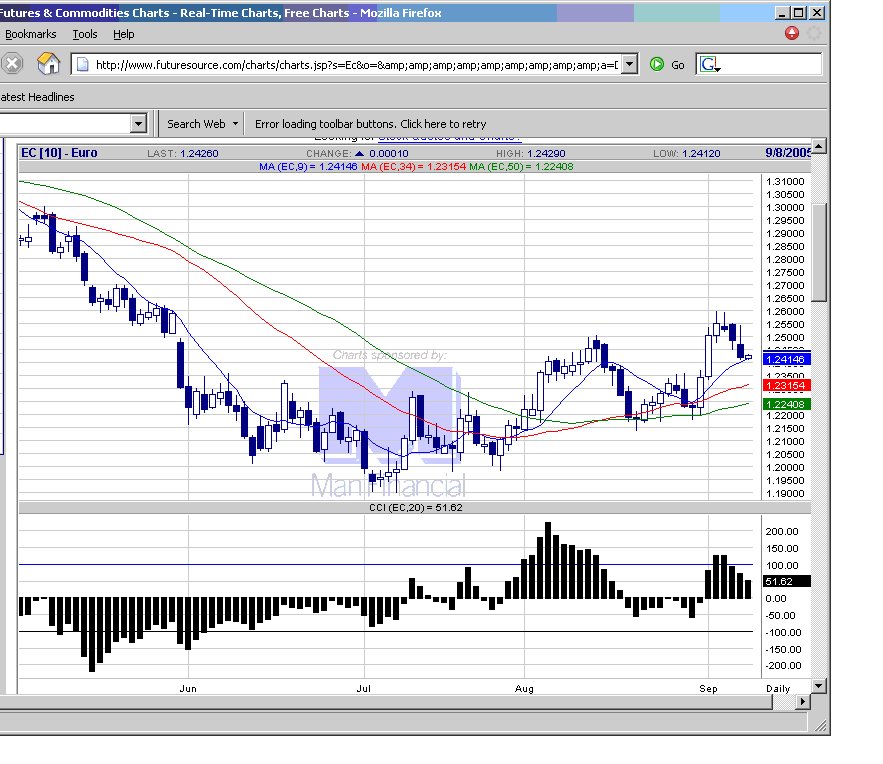
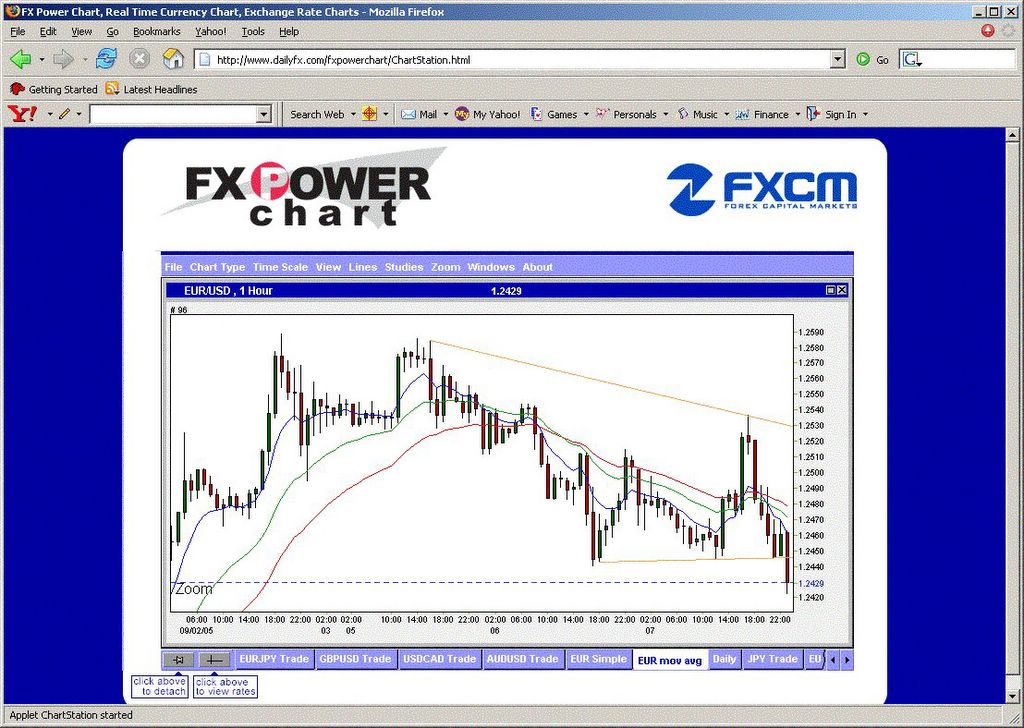
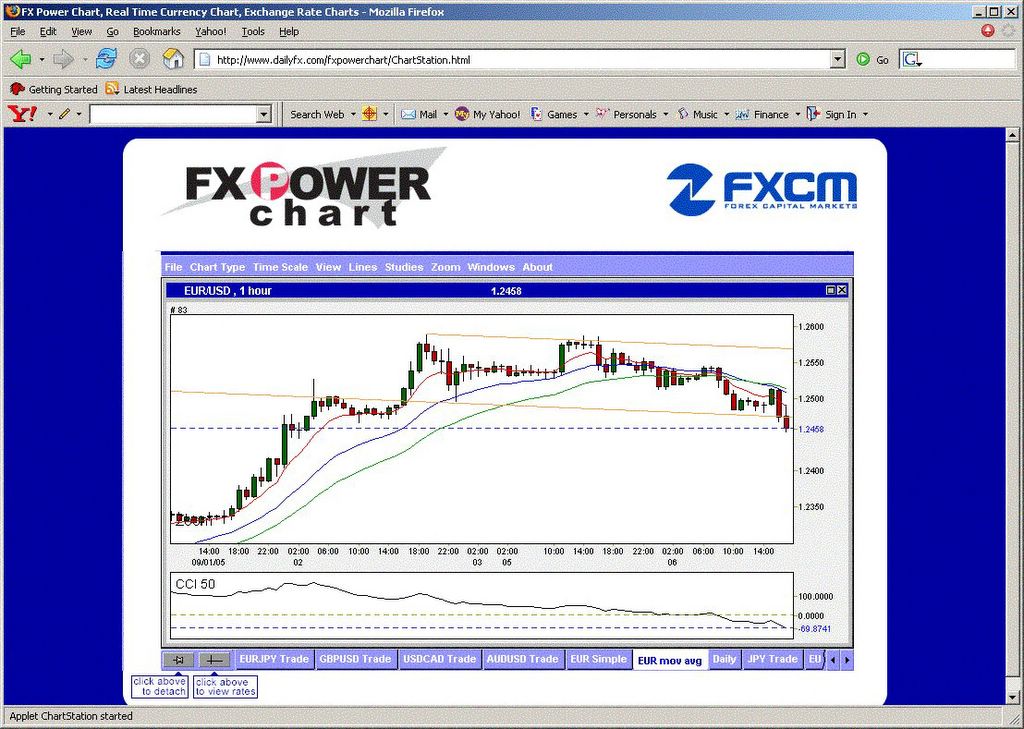
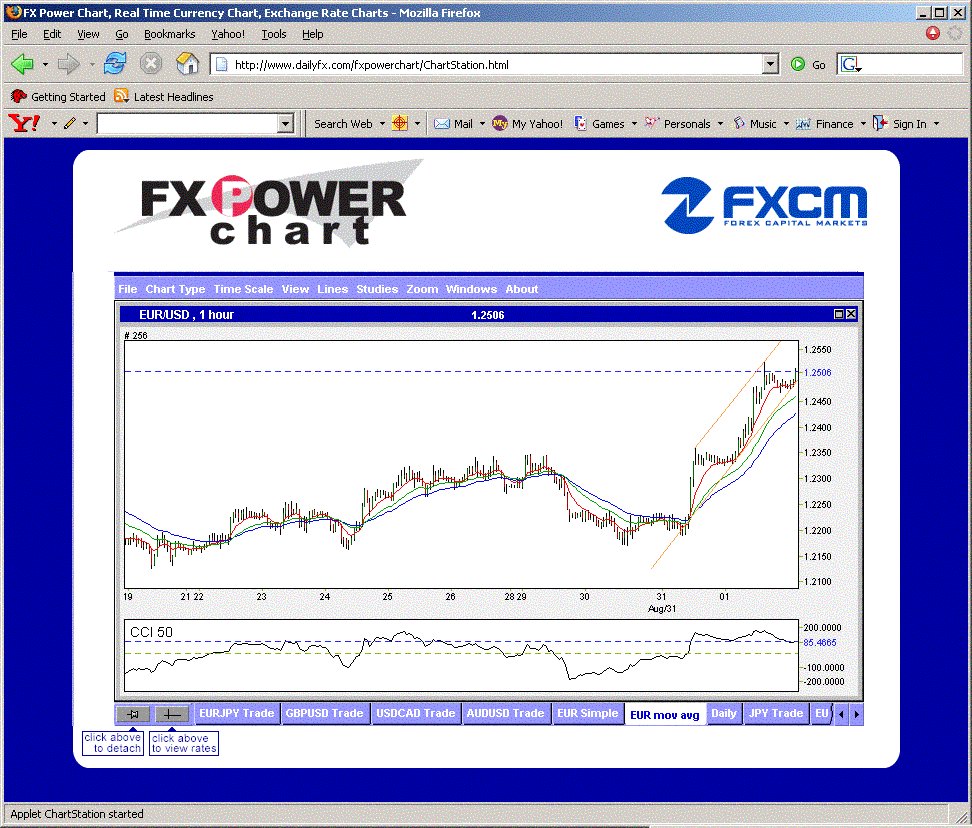
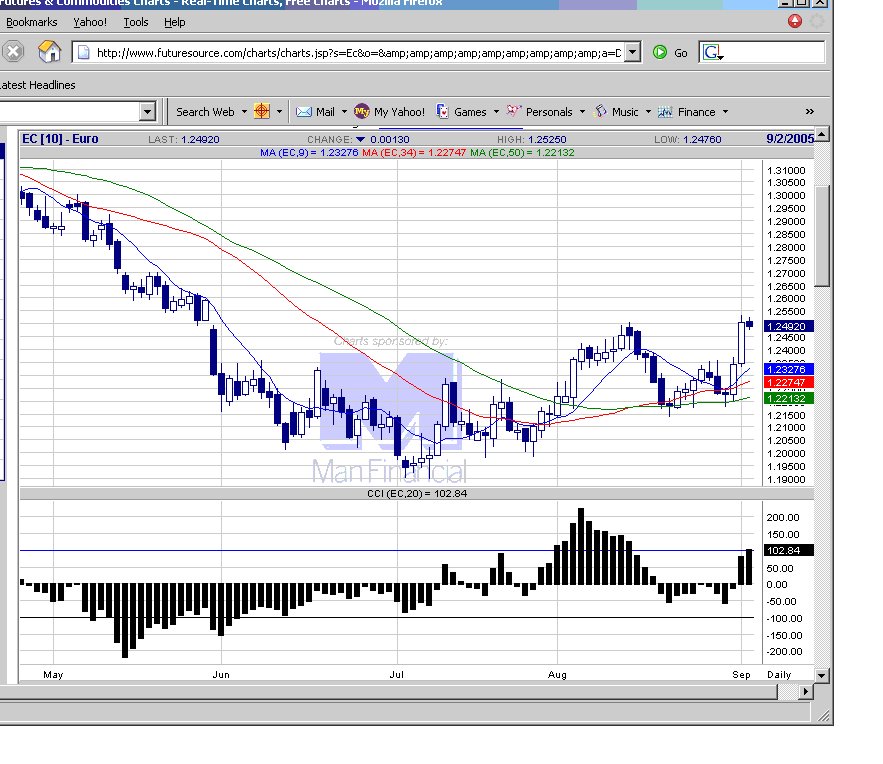
20050930 Downtrend in place. Moving average provided the overhead resistance.

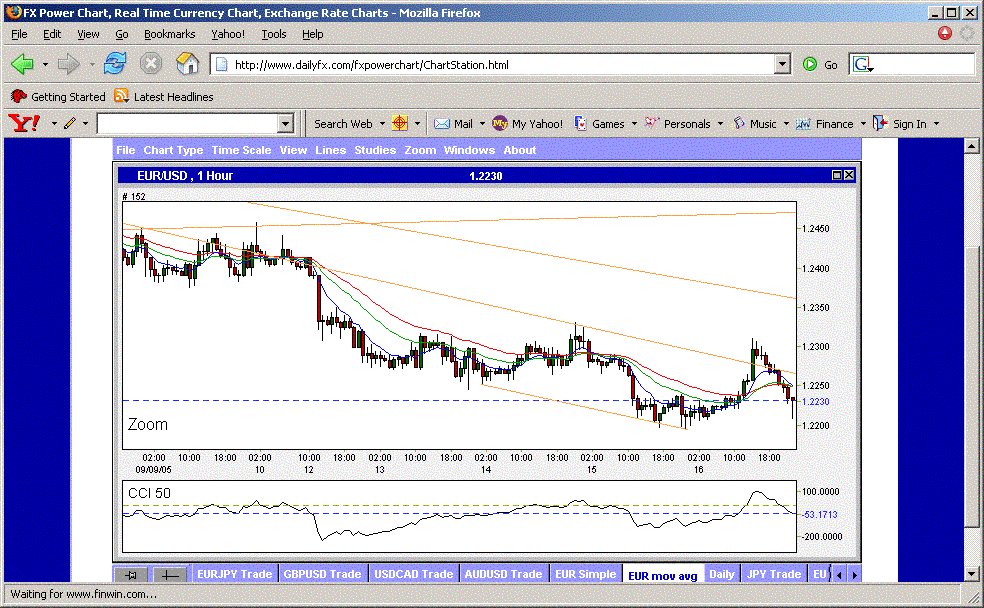
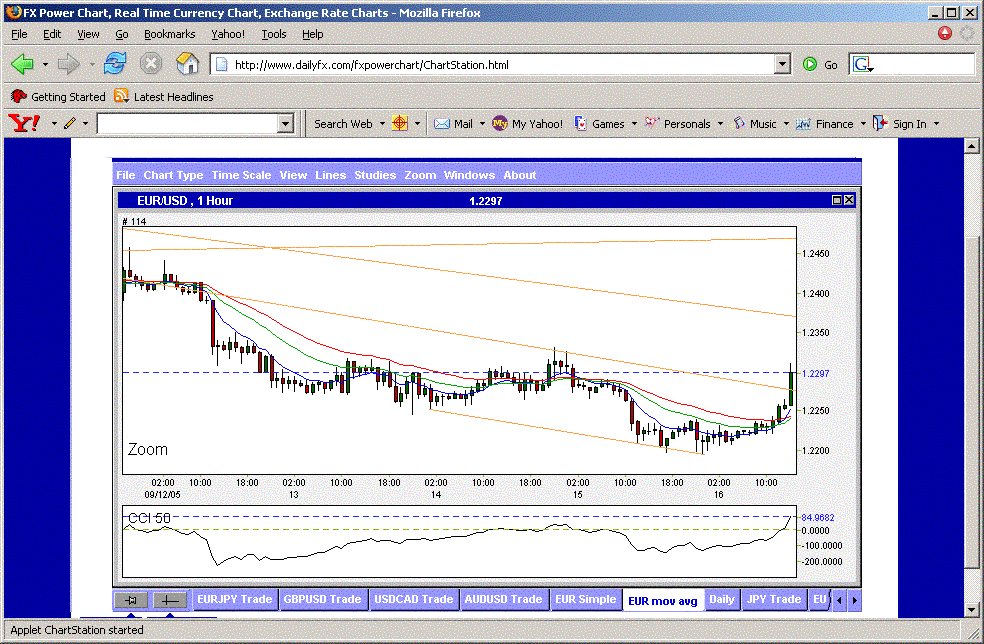
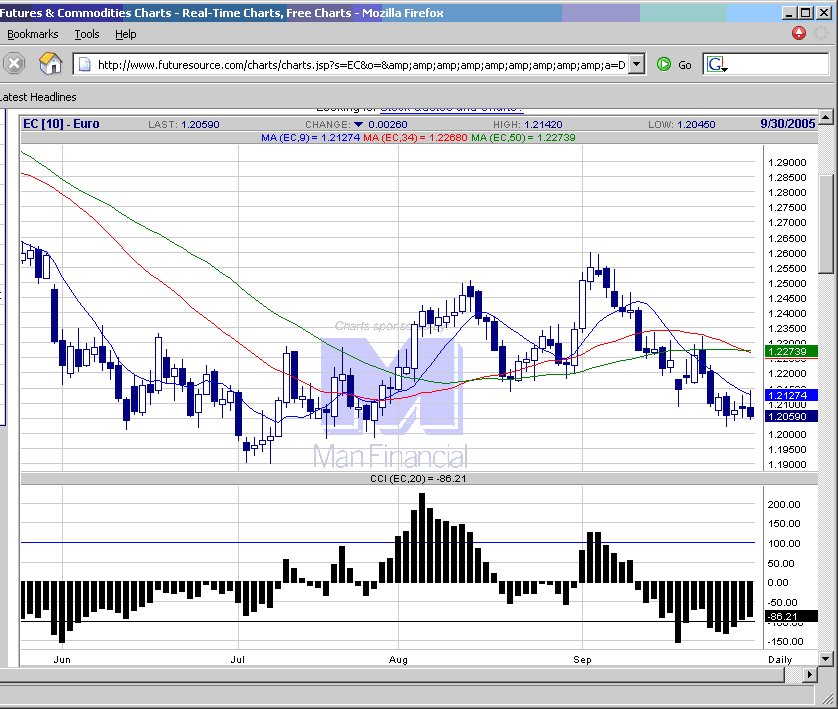 EURUSD chart
USDJPY chart
GBPUSD chart
USDCHF chart
posted by emacro @ 8:51 PM
![]()
![]()
Chronicle of the biggest, deepest and most liquid market in the world, the Eurofx market, traded on interbank spot forex market as Eur/Usd and on IMM as the Eurofx futures. Patterns include CCI patterns ZLR etc. IMPORTANT notice: Nothing in this website constitute any advice to buy or sell financial instruments. The contents of this website are for EDUCATIONAL purposes and should not be construed to constitute investment advice. Charts will be from FXCM Power Charts.
20050930 Downtrend in place. Moving average provided the overhead resistance.
EURUSD chart
posted by emacro @ 8:51 PM
![]()
![]()
 EURUSD chart
posted by emacro @ 9:33 PM
![]()
![]()
 EURUSD chart
posted by emacro @ 10:51 PM
![]()
![]()
 EURUSD chart
posted by emacro @ 10:04 PM
![]()
![]()
 EURUSD chart
posted by emacro @ 3:46 AM
![]()
![]()
 EURUSD chart
posted by emacro @ 9:45 AM
![]()
![]()
 EURUSD chart
posted by emacro @ 12:42 AM
![]()
![]()
 EURUSD chart
posted by emacro @ 8:31 PM
![]()
![]()
 EURUSD chart
posted by emacro @ 7:55 PM
![]()
![]()
 EURUSD chart
posted by emacro @ 9:32 PM
![]()
![]()
 EURUSD chart
posted by emacro @ 8:00 PM
![]()
![]()
 EURUSD chart
posted by emacro @ 9:16 AM
![]()
![]()
 EURUSD chart
posted by emacro @ 11:37 AM
![]()
![]()
For those of you regular visitors, I am thinking of putting the trade 'advice' on www.collective2.com, so that the info can be more timely. But catch is that you'd have to subscribe to the service and am thinking to charge US50 per trade, but ONLY if the trade turned out to be profitable.
posted by emacro @ 10:41 AM
![]()
![]()
 EURUSD chart
posted by emacro @ 3:33 AM
![]()
![]()
 EURUSD chart
posted by emacro @ 2:29 AM
![]()
![]()
 EURUSD chart
posted by emacro @ 9:36 PM
![]()
![]()
 EURUSD chart
posted by emacro @ 11:32 AM
![]()
![]()
 EURUSD chart
posted by emacro @ 5:36 AM
![]()
![]()