 20051130 EUR futures are volatile price action last 2 days. Bigger picture is for a sideways consolidation range until the next downside breakout move.
  EURUSD chart
USDJPY chart
GBPUSD chart
USDCHF chart
Chronicle of the biggest, deepest and most liquid market in the world, the Eurofx market, traded on interbank spot forex market as Eur/Usd and on IMM as the Eurofx futures. Patterns include CCI patterns ZLR etc. IMPORTANT notice: Nothing in this website constitute any advice to buy or sell financial instruments. The contents of this website are for EDUCATIONAL purposes and should not be construed to constitute investment advice. Charts will be from FXCM Power Charts.
 20051130 EUR futures are volatile price action last 2 days. Bigger picture is for a sideways consolidation range until the next downside breakout move.
  EURUSD chart
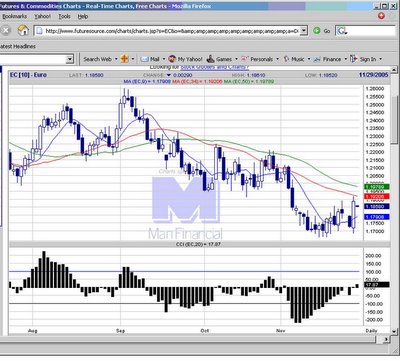 20051128 A strong rebound running stops on short positions. The 1.1925 level is good resistance. Would look for 1 to 2 more days of gains then an opportunity for short.
  EURUSD chart
 20051125 Sideways on daily chart, waiting for next breakout.
  EURUSD chart
 20051123 Short covering into Thanksgiving holiday continues. Funds lock in gains.
  EURUSD chart
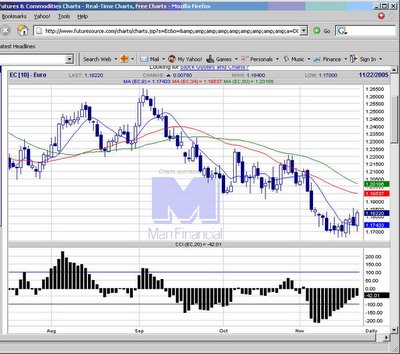 20051122 Indicators point to possible retracement upwards towards 1.1920.
  EURUSD chart
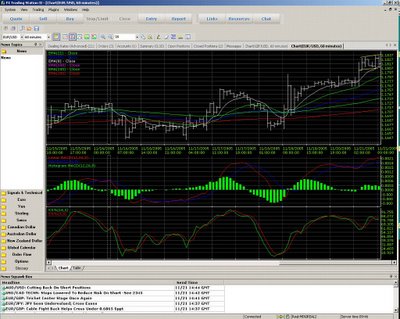 20051121 10:50 am. Bull flag forms on the 60 min EurUsd chart, indicating a buy on a break above 1.1838.
  EURUSD chart
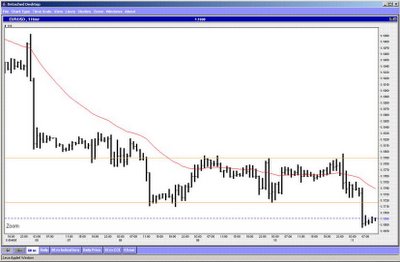 First break came to the upside on the foreign trade data release, which failed on the downsie break, a stop and reverse strategy would be in profit now.
  EURUSD chart
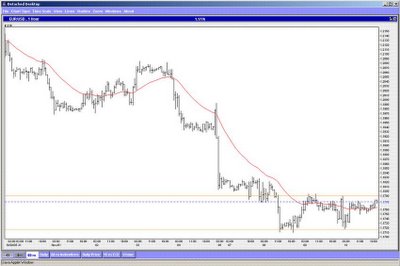 20051110 Ater the big moves since the Employment report last Friday, EuroUSD has a chance to settle down and scribe a consolidation pattern, a breakout of 1.1793 and breakdown of 1.1713 would lead to trade for a move of the width of the channel about 75 pips.
  EURUSD chart
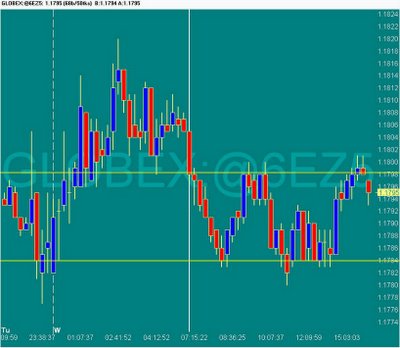 20051109 3:22 am ET. EUR in a band, setting up scalp breakout trade 1.1801 long and 1.1782 short, target 20 ticks.
  EURUSD chart
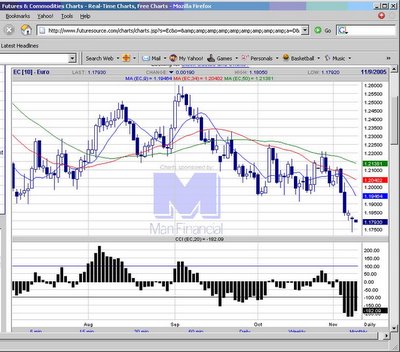 20051108 Downtrend firmly in place, but momentum down pauses. Looking to short retracements to the moving averages.
  EURUSD chart
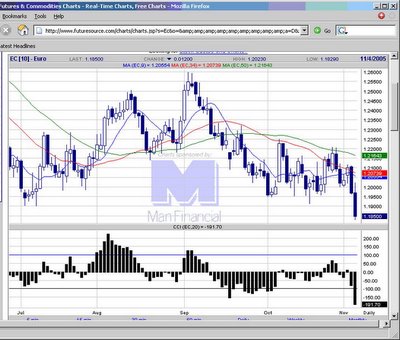 20051104 So the Eur futures broke the symmetrical triangle to the downside, pointing the way for further move down. CCI accelerates to downside, providing good momentum. Look for retracements to resistance for shorts next week.
  EURUSD chart
 20051103 Update on the USDJPY long off the symmetrical triangle.
  EURUSD chart
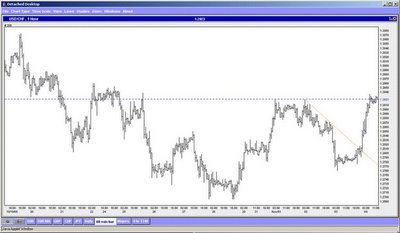 20051103 USDCHF setup for long today with the multiple test of the trendline resistance. Long signal was when the price action busted up through the resistance line.
  EURUSD chart
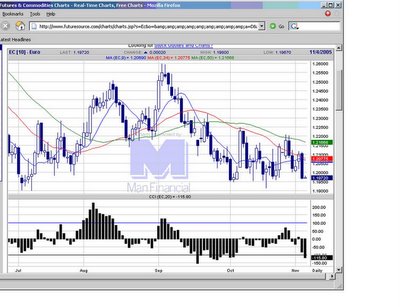 20051103 Breakdown in EUR futures. A good trde would have been the short on the break of the low of yesterday's candlestick.
  EURUSD chart
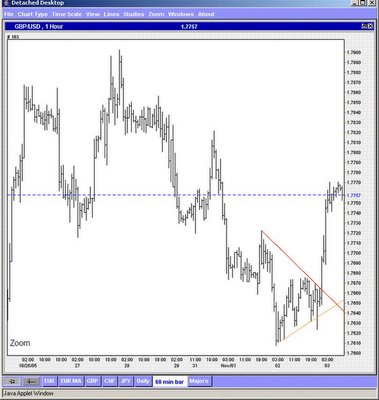 20051102 A symmetrical triangle setup on the cable today.
  EURUSD chart
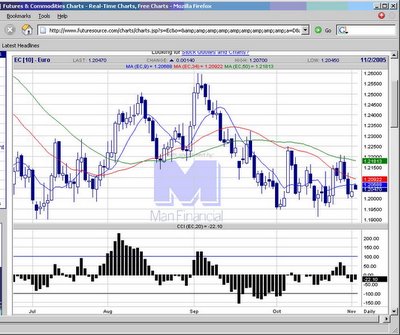
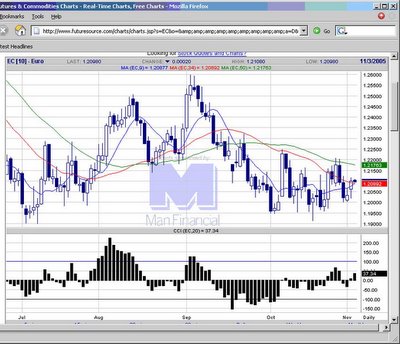 20051102 Big picture EUR futures is still within the big trading range, priming for the breakout.
  EURUSD chart
 20051101 Sideways triangle pattern, be on the lookout for breakout.
  EURUSD chart
 20051101 FOMC day sees an ID pattern, with moving averages straddlig the highs and lows=>potentialy explosive breakout moves either side.
  EURUSD chart