 20051230 ends the year 2005 with continuing sideways movement.
  EURUSD chart
USDJPY chart
GBPUSD chart
USDCHF chart
Chronicle of the biggest, deepest and most liquid market in the world, the Eurofx market, traded on interbank spot forex market as Eur/Usd and on IMM as the Eurofx futures. Patterns include CCI patterns ZLR etc. IMPORTANT notice: Nothing in this website constitute any advice to buy or sell financial instruments. The contents of this website are for EDUCATIONAL purposes and should not be construed to constitute investment advice. Charts will be from FXCM Power Charts.
 20051230 ends the year 2005 with continuing sideways movement.
  EURUSD chart
 20051228 Attempted a rally that failed today. Big picture is still sideways, coiling the spring for the move soon.
  EURUSD chart
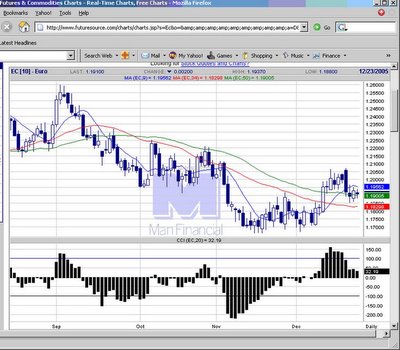 20051223 Indecisive candle spinning top in keeping with the pre-holiday trade.
  EURUSD chart
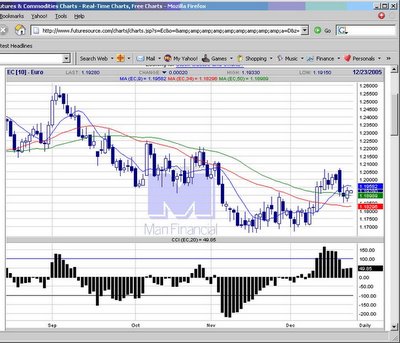 20051222 Winding down in tight range before the Xmas holidays.
  EURUSD chart
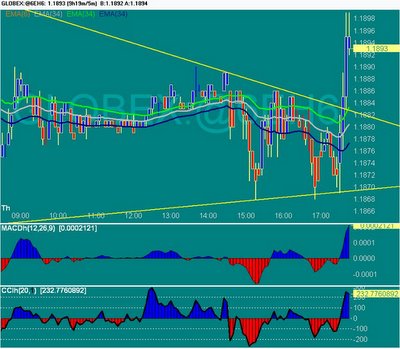 20051222 5:45 am ET. Year end volatility afforded a short term breakout trade today with confluence of a few factors, trendline breakout of congestion pattern (rectangle), MACD histogram momentum and CCI confirmation.
  EURUSD chart
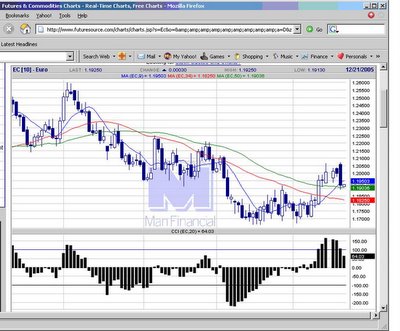 20051220 After the strong move out of the breakout of the consolidation, may be building up energy again for the next move.
  EURUSD chart
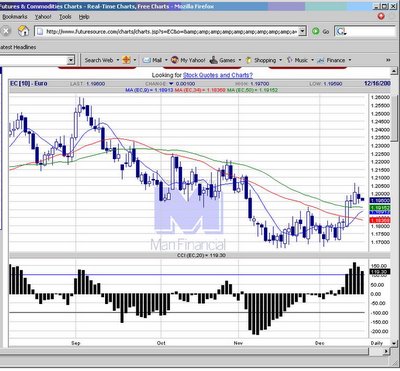 20051215 EUR futures falls back after the recent short covering.
  EURUSD chart
 20051215 A breakut of Swissy in progress off the congestion pattern.
  EURUSD chart
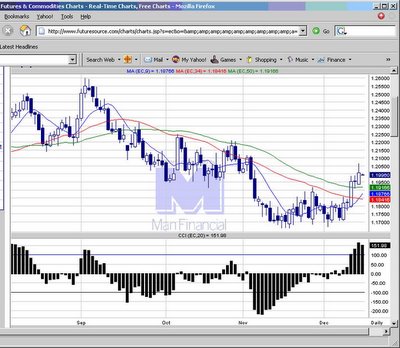 20051214 Follow through buying on the record highest US Trade Deficit figure USD68 billion for Nov.
  EURUSD chart
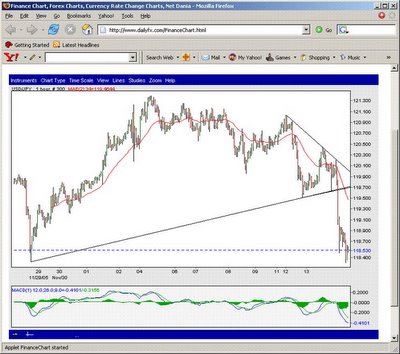 20051214 6:41 am ET. Break of the double suppot line for USDJPY on the Tanken report today.
  EURUSD chart
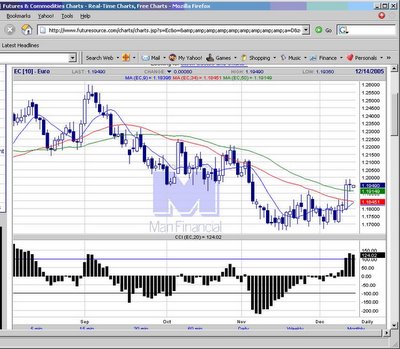 20051218 Fed day, FOMC raises interet rates 25 bp, remoes word "accomodation" from its statement. EUR daily chart shows aftermath of the breakout from the congestion range.
  EURUSD chart
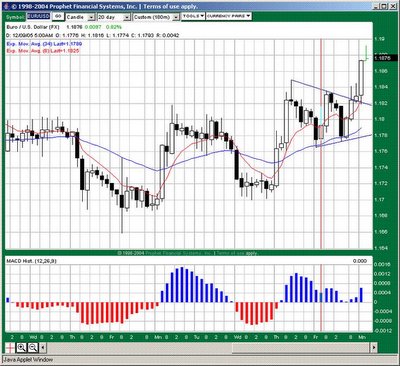 20051212 5:25 am ET. Exit second 1/2 position 1.1880.
  EURUSD chart
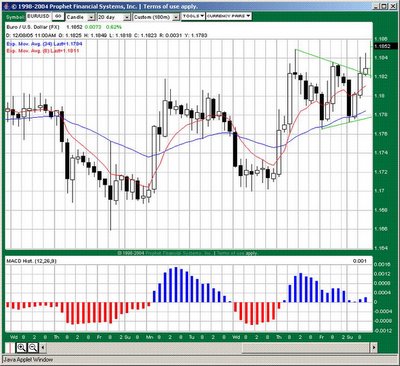 20051212 4:28 am ET. 1.1850 first target to take half off.
  EURUSD chart
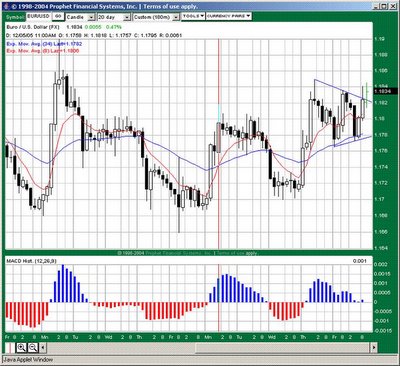 20051212 12:00 am ET. A breakout of the triangle. We got long 1.1840 and 1.1823, looking for targets 1.1850 and 1.1880 later today.
  EURUSD chart
 2005208 Continuing the sideways price action. Waiting for breaakout of the upper or lower horizontal trendlines.
  EURUSD chart
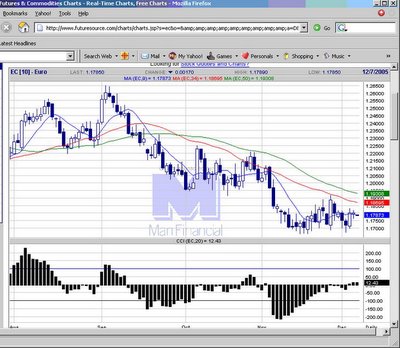 2005206 The longer this sideways consolidatin persists, the stronger the breakout. So we will wait for the breakout then try to climb on board.
  EURUSD chart
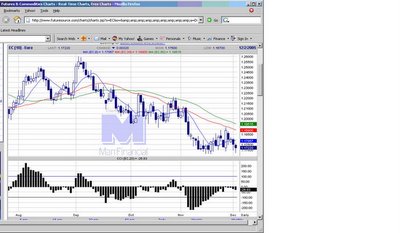 20051202 Within the range, building up energy for the next big move.
  EURUSD chart
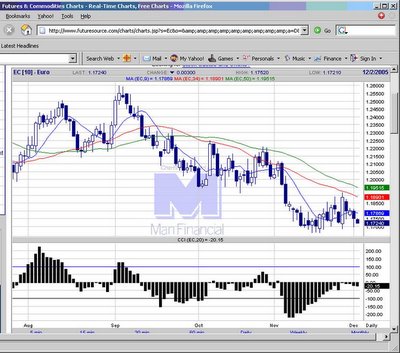 20051201 ZLR on CCI, however, the price action seems to be still consolidating sideways.
  EURUSD chart
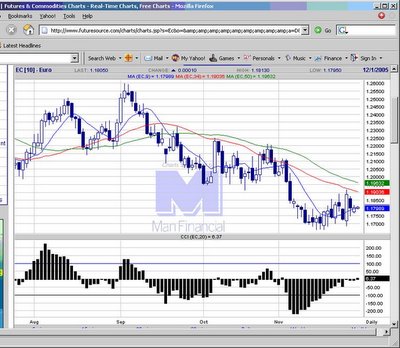 20051130 An ID pattern or inside day. Looking to go with the breakout either side.
  EURUSD chart