Euro Forex trading
Chronicle of the biggest, deepest and most liquid market in the world, the Eurofx market, traded on interbank spot forex market as Eur/Usd and on IMM as the Eurofx futures. Patterns include CCI patterns ZLR etc. IMPORTANT notice: Nothing in this website constitute any advice to buy or sell financial instruments. The contents of this website are for EDUCATIONAL purposes and should not be construed to constitute investment advice. Charts will be from FXCM Power Charts.
Tuesday, February 28, 2006
 20060228 11:00 am EST. EURJPY reached 138.44, so able to take partial profits along the way.
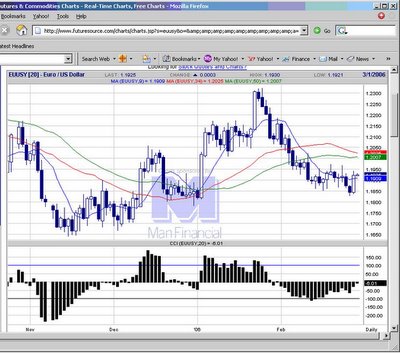
  EURUSD chart
USDJPY chart
GBPUSD chart
USDCHF chart
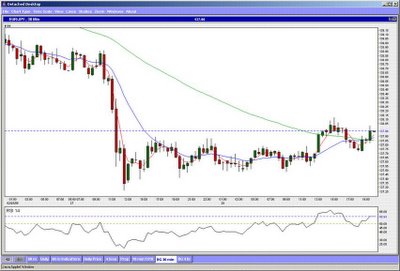 20060228 3 moving averages come together, according to the rules filter 25 pips woul put buy at 138.14.
  EURUSD chart
USDJPY chart
GBPUSD chart
USDCHF chart
Monday, February 27, 2006
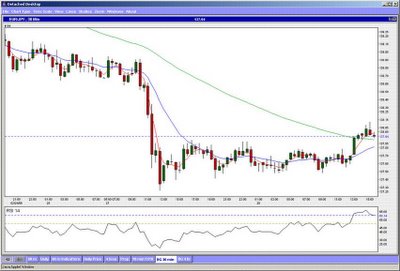 20060228 11:41 pm EST. After many hours of grind and test of support, EURJPY finally had a pop up. Let's see how far it can go.
  EURUSD chart
USDJPY chart
GBPUSD chart
USDCHF chart
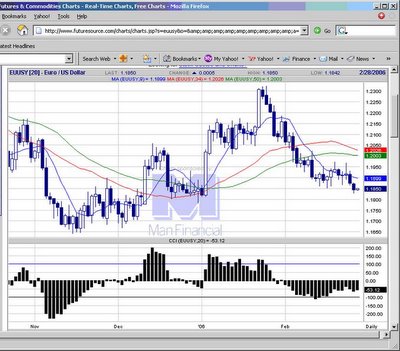 20060227 EURUSD continues downward, as expected.
  EURUSD chart
USDJPY chart
GBPUSD chart
USDCHF chart
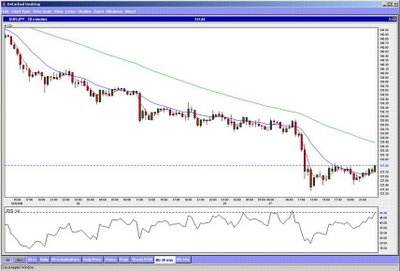 20060227 7:08 am EST. EURJPY has 1 possible 123 formatin 2 Coming off a large downside move (oversold conditions) 3 Moving avg crossover. So long for possible move back up due to profit taking and short covering.
  EURUSD chart
USDJPY chart
GBPUSD chart
USDCHF chart
Friday, February 24, 2006
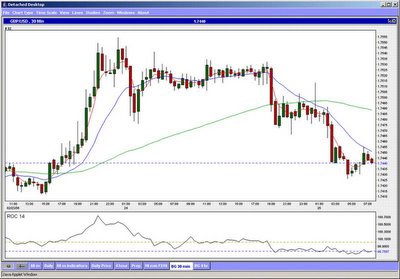 20060224 Closing GBPUSD is lower than our entry price 1.7498, although a spike up was < 10 pips awa from hitting the by stop.
  EURUSD chart
USDJPY chart
GBPUSD chart
USDCHF chart
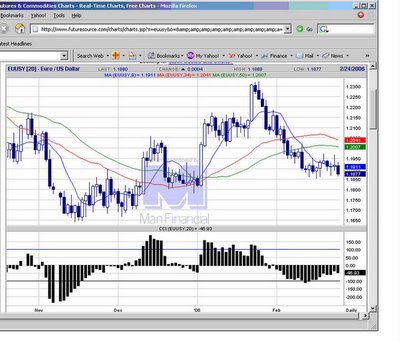 20060224 Daily chart EURUSD shows down candle indicating selling interest, could signal start of down move out of big consolidation range.
  EURUSD chart
USDJPY chart
GBPUSD chart
USDCHF chart
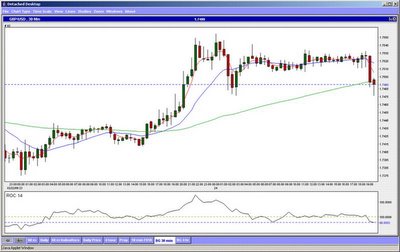 20060228 3:49 am EST. GBPUSD mov avg crossover down, short 1.7498 stop 1.7527. Let's see how this goes.
  EURUSD chart
USDJPY chart
GBPUSD chart
USDCHF chart
Thursday, February 23, 2006
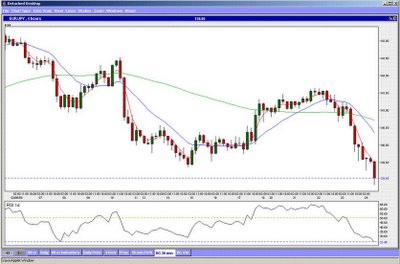 20060224 10:30 pm EST. 24 hours on EURJPY has made a good move down.
  EURUSD chart
USDJPY chart
GBPUSD chart
USDCHF chart
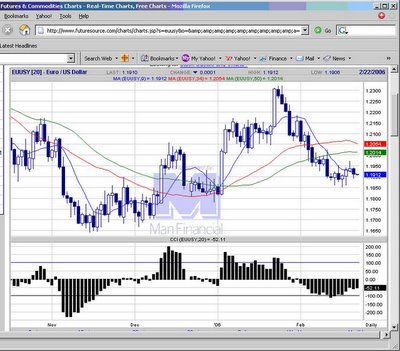
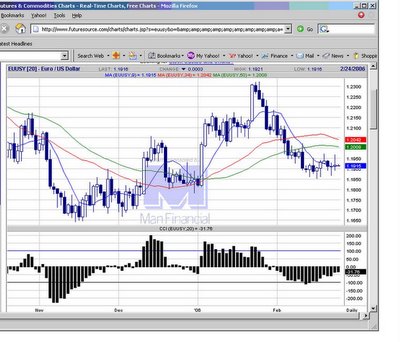 20060223 EURUSD daily chart update. A big indecisive spinning top again. Could be building up steam for the next move.
  EURUSD chart
USDJPY chart
GBPUSD chart
USDCHF chart
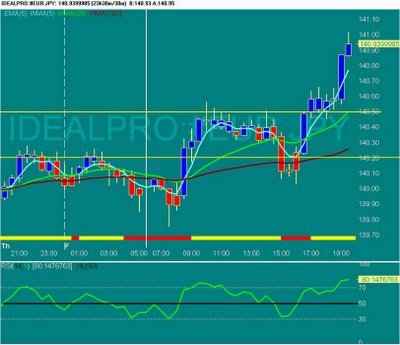
 20060223 Entry short 140.95 on EURJPY, 123 pattern with mov avg cross down.
  EURUSD chart
USDJPY chart
GBPUSD chart
USDCHF chart
Wednesday, February 22, 2006
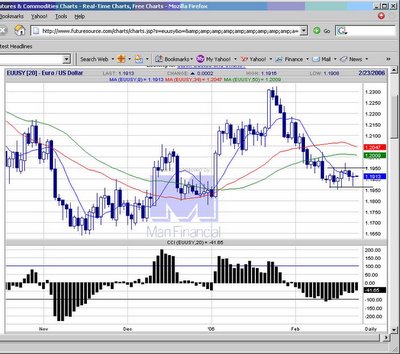 20060222 Daily EURUSD chart update. A apinning top formation on candlesticks.
  EURUSD chart
USDJPY chart
GBPUSD chart
USDCHF chart
Tuesday, February 21, 2006
Friday, February 17, 2006
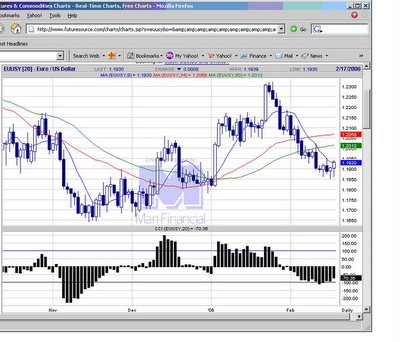 20060217 Daily chart Euro, testing key moving average resistance.
  EURUSD chart
USDJPY chart
GBPUSD chart
USDCHF chart
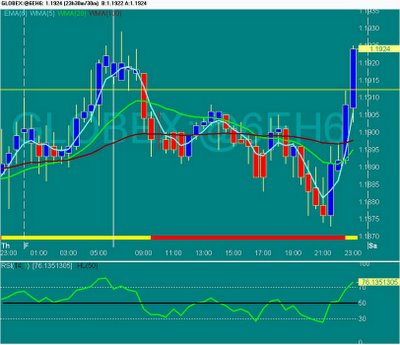 20060217 10:00 am ET. A nice short term scalp @ 1.1912 on EUR futures, 10 ticks in about 5 minutes. Eurofx futures have 1 tick spread, which makes these sort of trade viable, especially in US market hours.
  EURUSD chart
USDJPY chart
GBPUSD chart
USDCHF chart
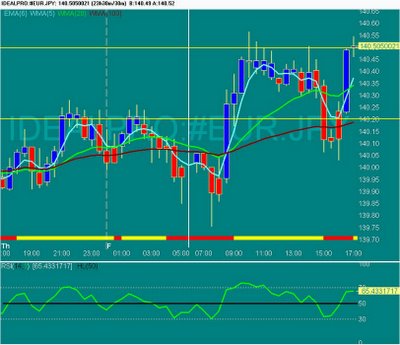 20060217 4:05 am ET. Reentry long EURJPY 140.52 stop 140.25.
  EURUSD chart
USDJPY chart
GBPUSD chart
USDCHF chart
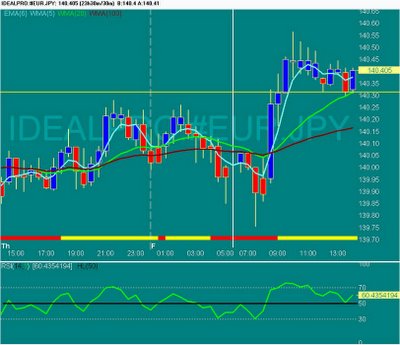 20060217 Partial profit taken, longs still in play, despite coming back to test initial entry level.
  EURUSD chart
USDJPY chart
GBPUSD chart
USDCHF chart
Thursday, February 16, 2006
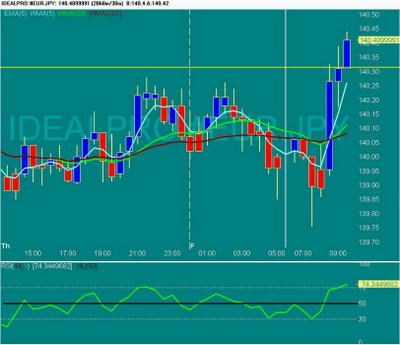 20060216 8:57 pm ET. Long EURJPY @ 140.32 stop 140.07.
  EURUSD chart
USDJPY chart
GBPUSD chart
USDCHF chart
 20060216 8:35 am ET. Retests the high again for the chance ot lock in partial profits, on release of the initial jobless claims data.
  EURUSD chart
USDJPY chart
GBPUSD chart
USDCHF chart
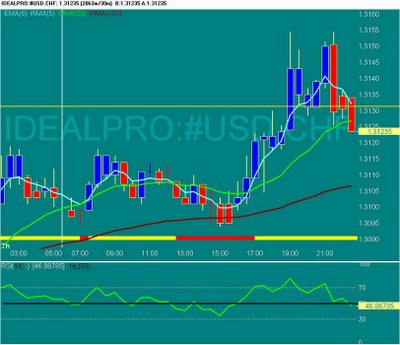
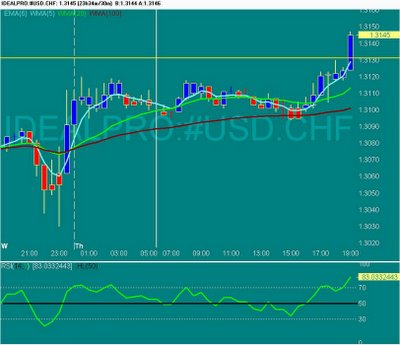 20060216 7:18 am. USDCHF crossed over the tribber price of 1.3132, so we long at the same price on a limit stop order. Let's see how this trade goes.
  EURUSD chart
USDJPY chart
GBPUSD chart
USDCHF chart
