 20060929 0041 GMT. EURUSD breaks lower with some momentum.
  EURUSD chart
USDJPY chart
GBPUSD chart
USDCHF chart
Chronicle of the biggest, deepest and most liquid market in the world, the Eurofx market, traded on interbank spot forex market as Eur/Usd and on IMM as the Eurofx futures. Patterns include CCI patterns ZLR etc. IMPORTANT notice: Nothing in this website constitute any advice to buy or sell financial instruments. The contents of this website are for EDUCATIONAL purposes and should not be construed to constitute investment advice. Charts will be from FXCM Power Charts.
 20060929 0041 GMT. EURUSD breaks lower with some momentum.
  EURUSD chart
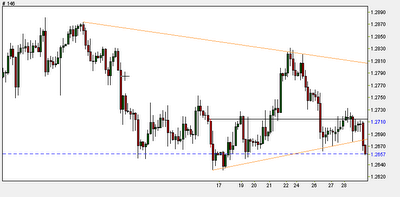 20060929 0812 GMT. EURUSD breaks the trendline as expected.
EURUSD chart
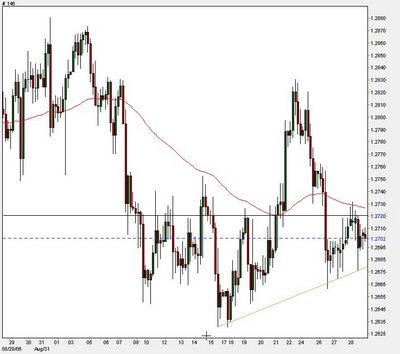 20060929 0100 GMT. EURUSD, watching the trendline for signs of break.
  EURUSD chart
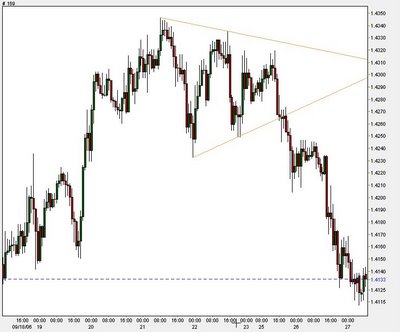 20060927 0058 GMT. EURCAD continues the move down after the bear flag break.
  EURUSD chart
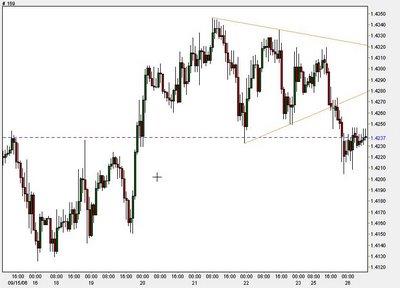 20060926 0025GMT. EURCAD forms bear flag possibility.
  EURUSD chart
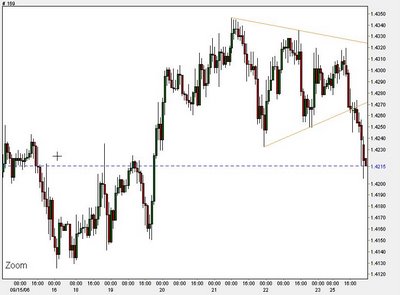 20060925 1500GMT. EURCAD prudent move would be to lock in profits for 1/2 position, holding 1/2 for the bigger move.
  EURUSD chart
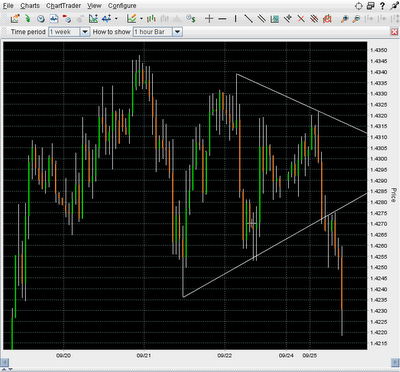 20060925 1354 GMT. EURCAD shorts in good stead with the momentum in this break.
EURUSD chart
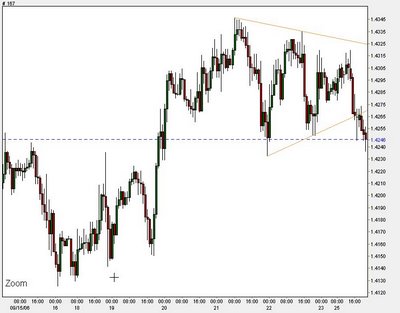 20060925 1330 GMT. EURCAD break gets going, let's see how far it goes.
  EURUSD chart
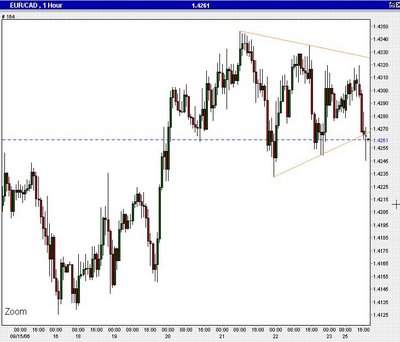 20060925 1000GMT. EURCAD breaking to downside of a 'spring coil' pattern for the short.
  EURUSD chart
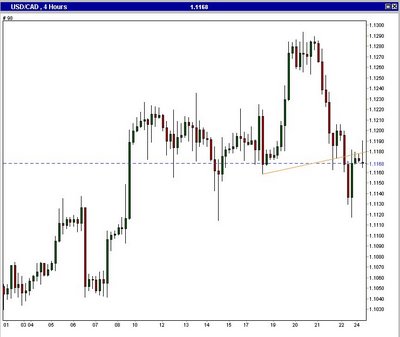 20060925 0237 GMT. USDCAD pulls back to the neckline of the H&S pattern.
  EURUSD chart
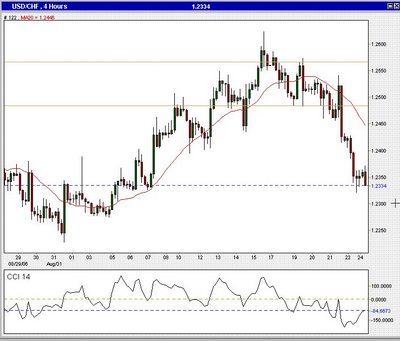 20060925 0235 GMT. USDCHF defined downtrend on 4 hr chart.
  EURUSD chart
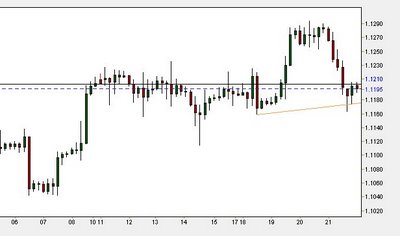 20060921 2353 EST. Watching USDCAD for break of trendline, possible H&S top on 4 hr chart.
  EURUSD chart
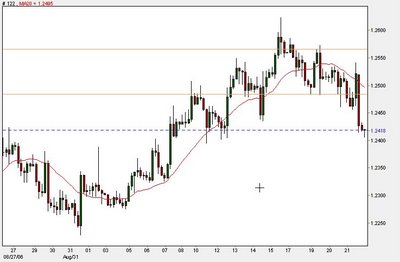 20060921 2057 EST. USDCHF 4 hr, a chart to watch for move down.
  EURUSD chart
 20060920 Watching EURUSD for breakout of sideways movement.
  EURUSD chart
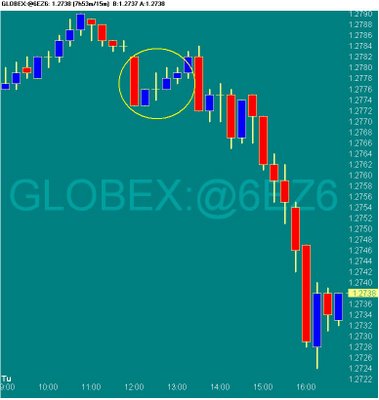 20060919 0451 EST. EUR futures, nice short pattern on 15 min chart in the ellipse area.
  EURUSD chart
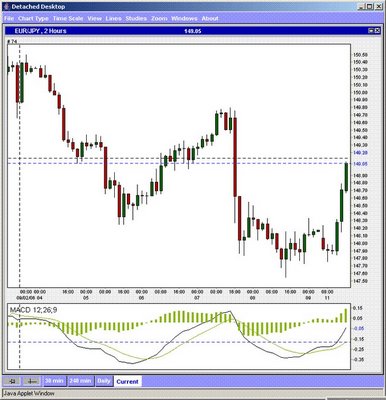 20060911 0539 EST. EURJPY shorts covered when the 2 hr MACD drosses up.
  EURUSD chart
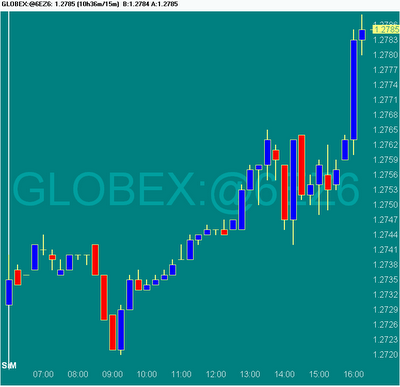
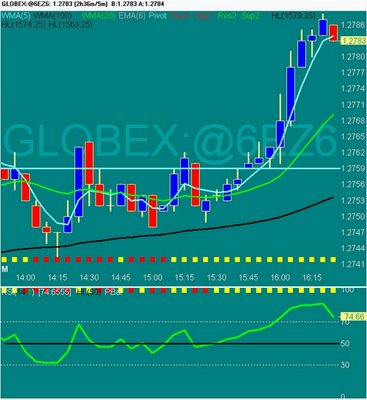 20060911 04:25 EST. Eur futures rally on 5 min and 15 min chart.
  EURUSD chart
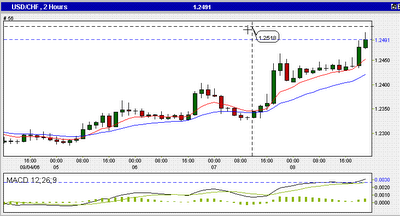
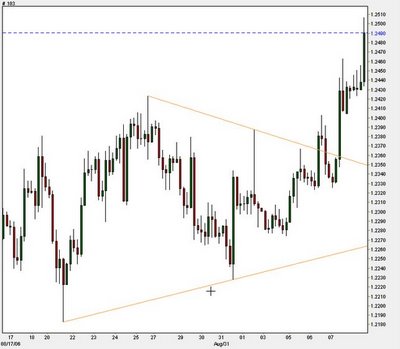 20060908 10:31 am EST. USDCHF longs since the breakout 2 days ago. Would look to set up some exit criteria on the 2 hr chart.
  EURUSD chart
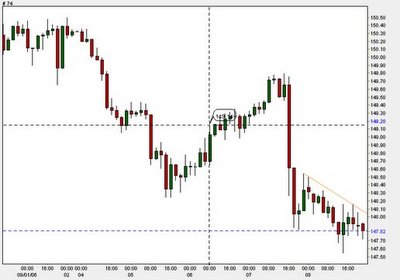 20060908 10:28 EST. EURJPY exits set up on either close above the downtrend line or the cross up of the MACD on the 2 hr chart.
  EURUSD chart
 20060908 2045 EST. Continuation of the breakout on USDCHF.
  EURUSD chart
 20060907 EURUSD showing hand, could be the start of the break to downside.
  EURUSD chart
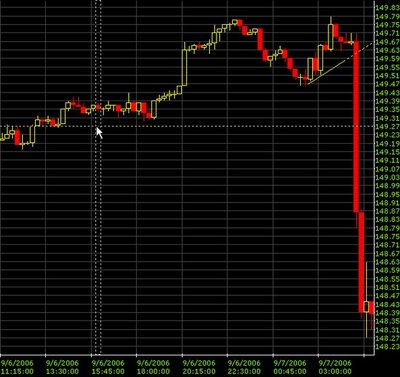 20060907 0534 EST. Possible that the record short JPY positions are liquidating. Could see a 3-4 large move.
  EURUSD chart