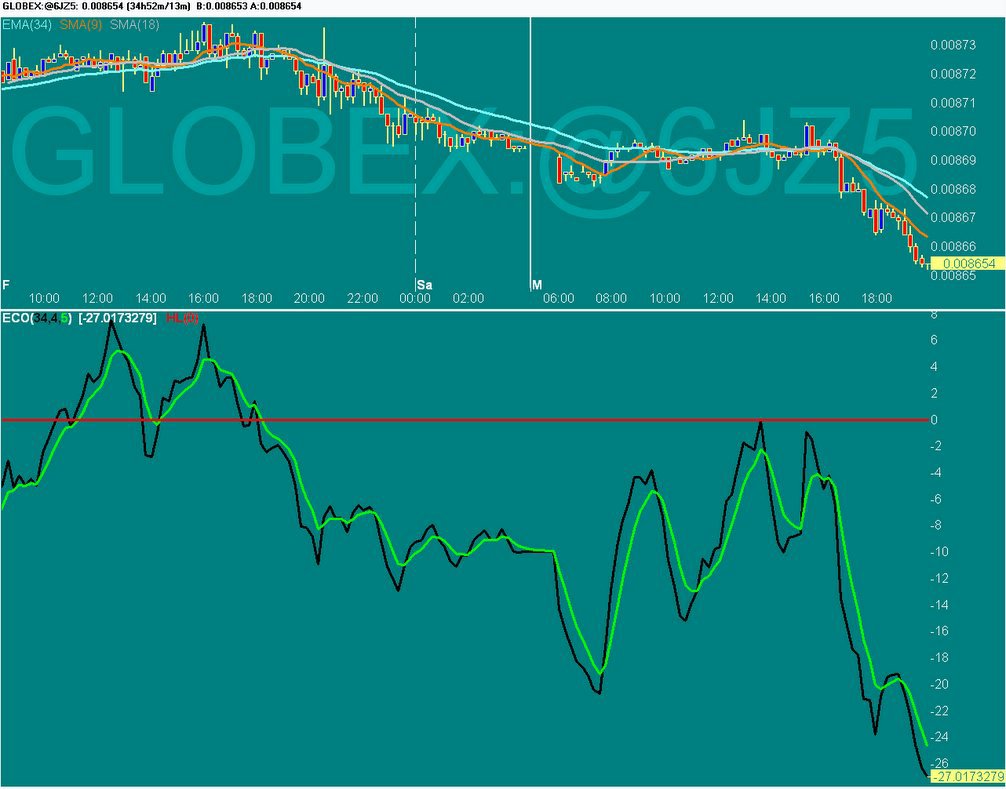
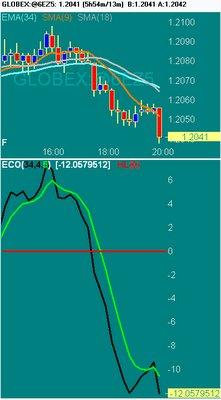
 20051031 JPY futures 13 minute chart shows ECO below zero all the way through the breakout.
  EURUSD chart
USDJPY chart
GBPUSD chart
USDCHF chart
posted by emacro @ 7:54 AM
![]()
![]()
Chronicle of the biggest, deepest and most liquid market in the world, the Eurofx market, traded on interbank spot forex market as Eur/Usd and on IMM as the Eurofx futures. Patterns include CCI patterns ZLR etc. IMPORTANT notice: Nothing in this website constitute any advice to buy or sell financial instruments. The contents of this website are for EDUCATIONAL purposes and should not be construed to constitute investment advice. Charts will be from FXCM Power Charts.
20051031 JPY futures 13 minute chart shows ECO below zero all the way through the breakout.
EURUSD chart
posted by emacro @ 7:54 AM
![]()
![]()
posted by emacro @ 7:51 AM
![]()
![]()
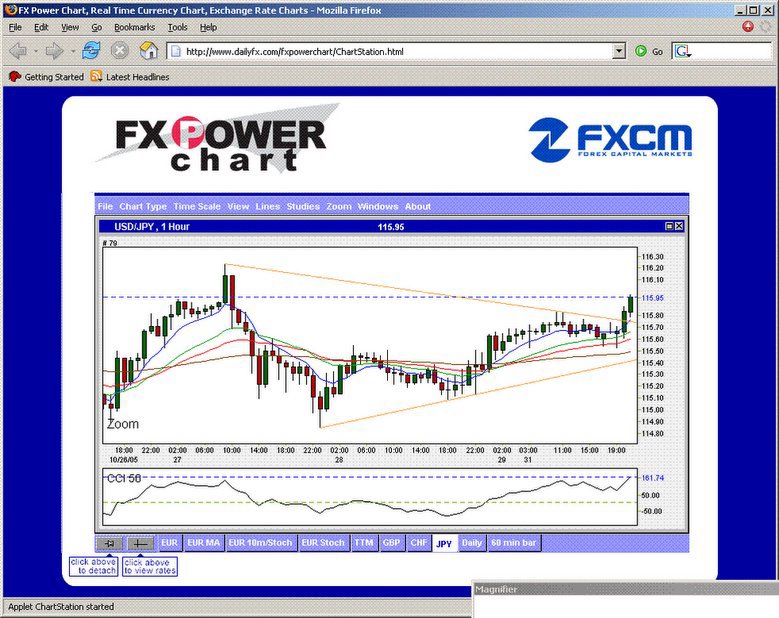 2005103 6:50am ET. The breakout was to the upside.
EURUSD chart
2005103 6:50am ET. The breakout was to the upside.
EURUSD chart
posted by emacro @ 5:58 AM
![]()
![]()
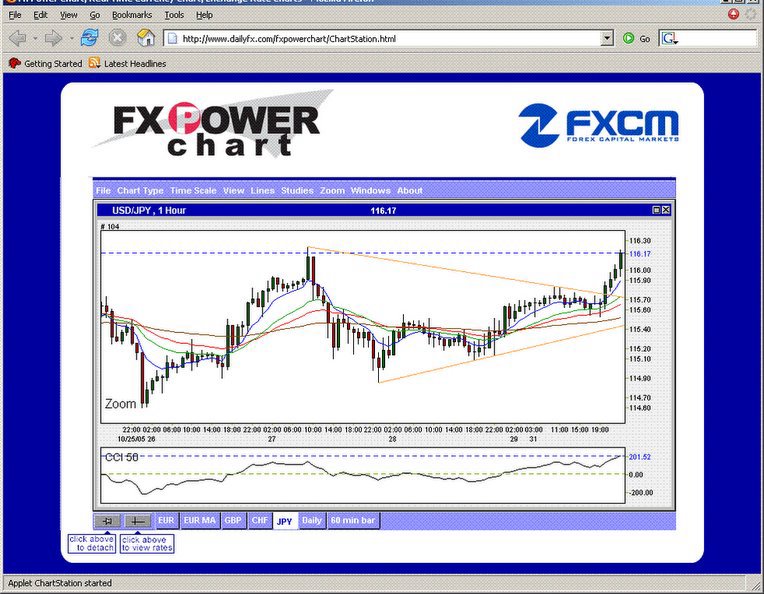
 20051031 4:22 am EST. USDJPY is forming a symmetrical triangle pattern. Some newsflow out of Japan BOJ, indicates could well break to the downside.
EURUSD chart
20051031 4:22 am EST. USDJPY is forming a symmetrical triangle pattern. Some newsflow out of Japan BOJ, indicates could well break to the downside.
EURUSD chart
posted by emacro @ 3:26 AM
![]()
![]()
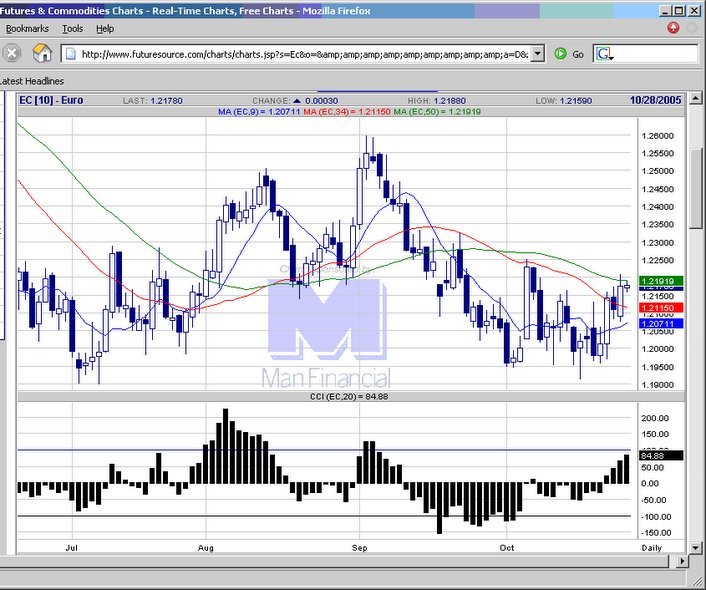
 20051028 An ID pattern, indicating possibility of breakout either way.
EURUSD chart
20051028 An ID pattern, indicating possibility of breakout either way.
EURUSD chart
posted by emacro @ 9:56 PM
![]()
![]()
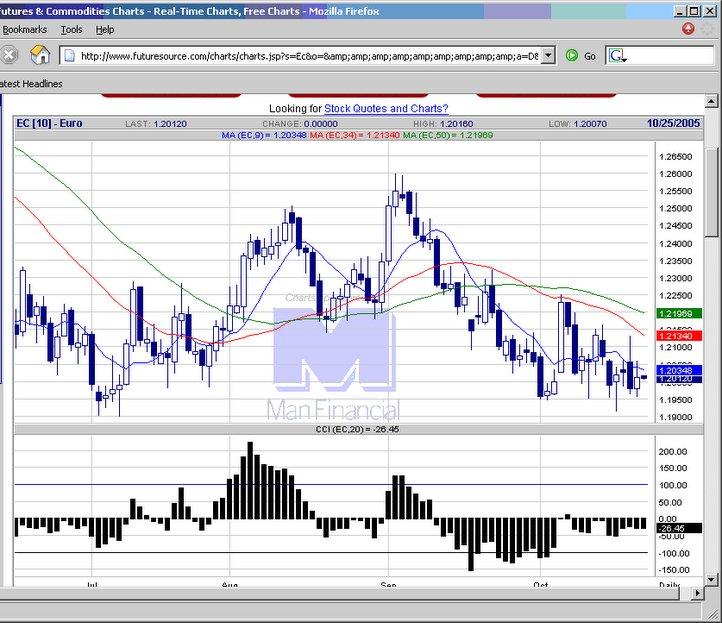
 20051027 Continued upside on booking profits fom long dollar positions. Resistance 1.2250.
EURUSD chart
20051027 Continued upside on booking profits fom long dollar positions. Resistance 1.2250.
EURUSD chart
posted by emacro @ 11:23 PM
![]()
![]()
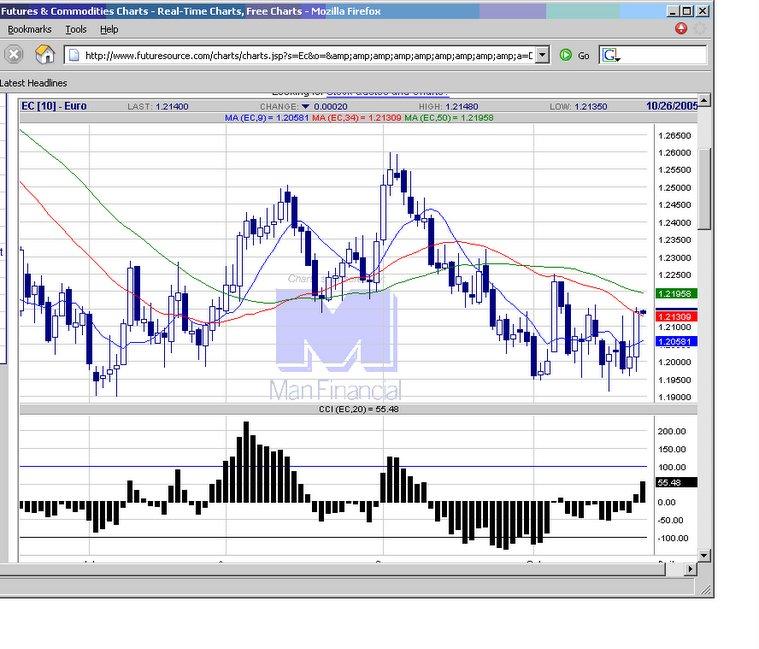 20051025 Strong move up now testing the moving average. If resistance holds, down trend could resme, However CCI momentum now is positive.
EURUSD chart
20051025 Strong move up now testing the moving average. If resistance holds, down trend could resme, However CCI momentum now is positive.
EURUSD chart
posted by emacro @ 12:26 AM
![]()
![]()
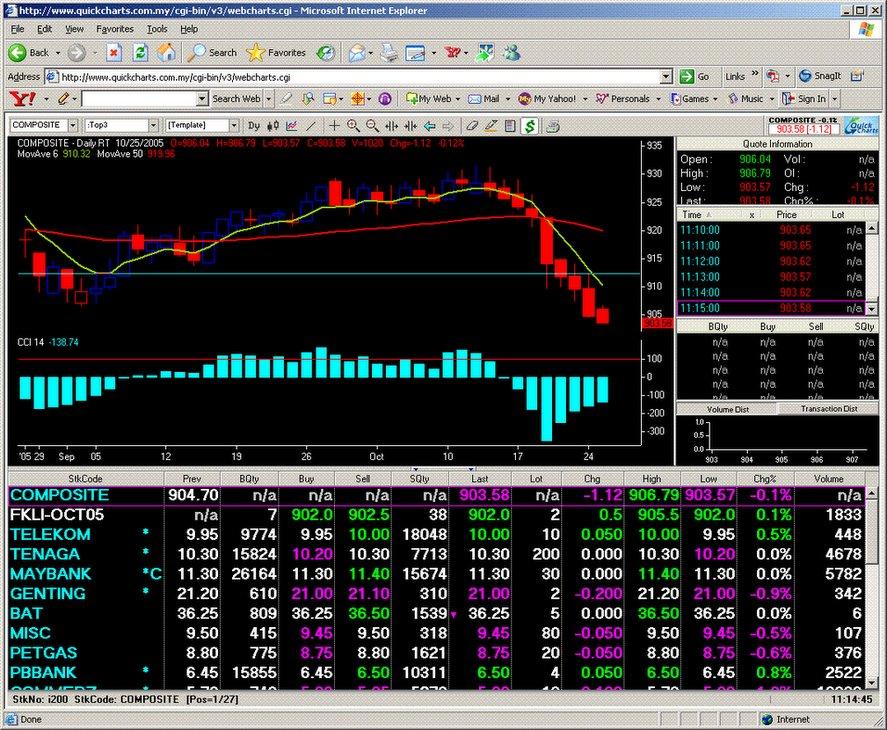 20051025 11:05 am. The cash daily chart with the downtick this morning now shows 9 consecutive days down. May be a good time to think about long fkli positions for a 2-3 day move back up for the cash index.
EURUSD chart
20051025 11:05 am. The cash daily chart with the downtick this morning now shows 9 consecutive days down. May be a good time to think about long fkli positions for a 2-3 day move back up for the cash index.
EURUSD chart
posted by emacro @ 11:17 PM
![]()
![]()
 20051024 A pesud ID pattern today, looking for possible breakout trade Tuesday.
EURUSD chart
20051024 A pesud ID pattern today, looking for possible breakout trade Tuesday.
EURUSD chart
posted by emacro @ 7:26 PM
![]()
![]()
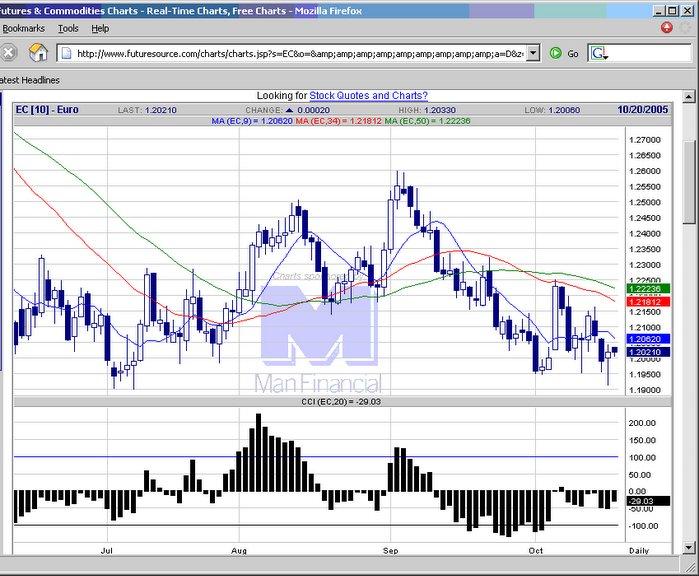
 20051021 Downtrend seems to be firmly in place, look for opportunities to short for position traders.
EURUSD chart
20051021 Downtrend seems to be firmly in place, look for opportunities to short for position traders.
EURUSD chart
posted by emacro @ 9:30 PM
![]()
![]()
 20051021 8:03 am snapshot of EUR futures 13 min chart shows downtrend.
EURUSD chart
20051021 8:03 am snapshot of EUR futures 13 min chart shows downtrend.
EURUSD chart
posted by emacro @ 8:04 AM
![]()
![]()
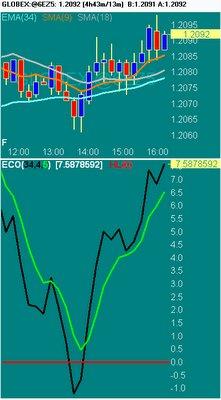 The Ergodic Candlestick Oscillator (ECO) thought out by William Blau, providea another too in the trader's arsenal in the day trading arena. Here 21 Oct 4:16 am ET snapshot of the 13 min chart EUR futures with the ECO.
EURUSD chart
The Ergodic Candlestick Oscillator (ECO) thought out by William Blau, providea another too in the trader's arsenal in the day trading arena. Here 21 Oct 4:16 am ET snapshot of the 13 min chart EUR futures with the ECO.
EURUSD chart
posted by emacro @ 4:18 AM
![]()
![]()
 20051019 Some buying support put in near lows of today's candlestick.
EURUSD chart
20051019 Some buying support put in near lows of today's candlestick.
EURUSD chart
posted by emacro @ 8:05 PM
![]()
![]()
 20051018 Shorting on the downside break of the psdudo ID identified earlier was a good strategy. PPI data showed wholesale infation at 4 year high caused by Katrina hurricane prompts interest rate hike speculation.
EURUSD chart
20051018 Shorting on the downside break of the psdudo ID identified earlier was a good strategy. PPI data showed wholesale infation at 4 year high caused by Katrina hurricane prompts interest rate hike speculation.
EURUSD chart
posted by emacro @ 8:16 PM
![]()
![]()
 20051017 Not quite an ID pattern, otherwise would have looked for breakout either side. But the pattern is sideways consolidation, could be building up the coil in the spring.
EURUSD chart
20051017 Not quite an ID pattern, otherwise would have looked for breakout either side. But the pattern is sideways consolidation, could be building up the coil in the spring.
EURUSD chart
posted by emacro @ 8:04 PM
![]()
![]()
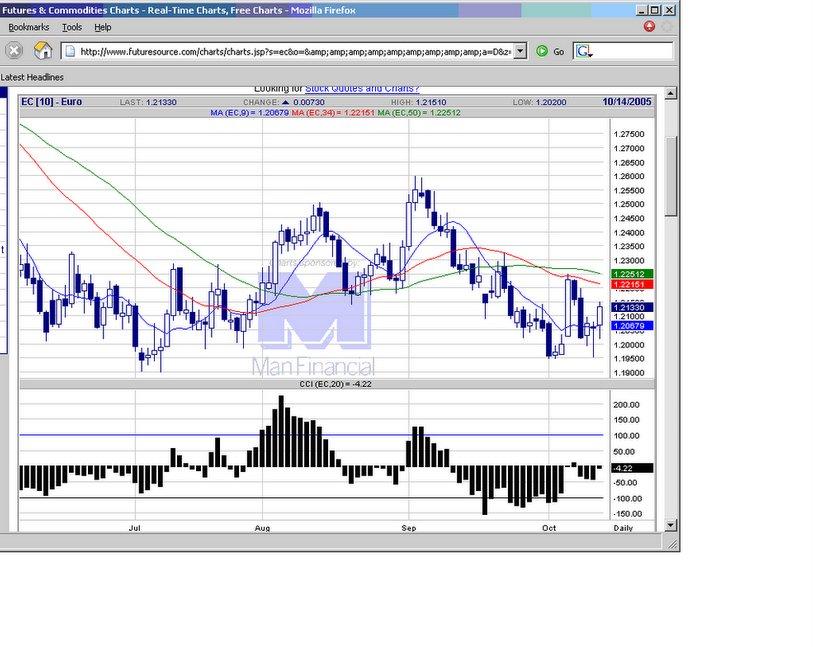 20051014 Euro futures ends up positive as alluded to yesterday. 1.2079, the moving average resistance broke the downtrend.
EURUSD chart
20051014 Euro futures ends up positive as alluded to yesterday. 1.2079, the moving average resistance broke the downtrend.
EURUSD chart
posted by emacro @ 11:01 PM
![]()
![]()
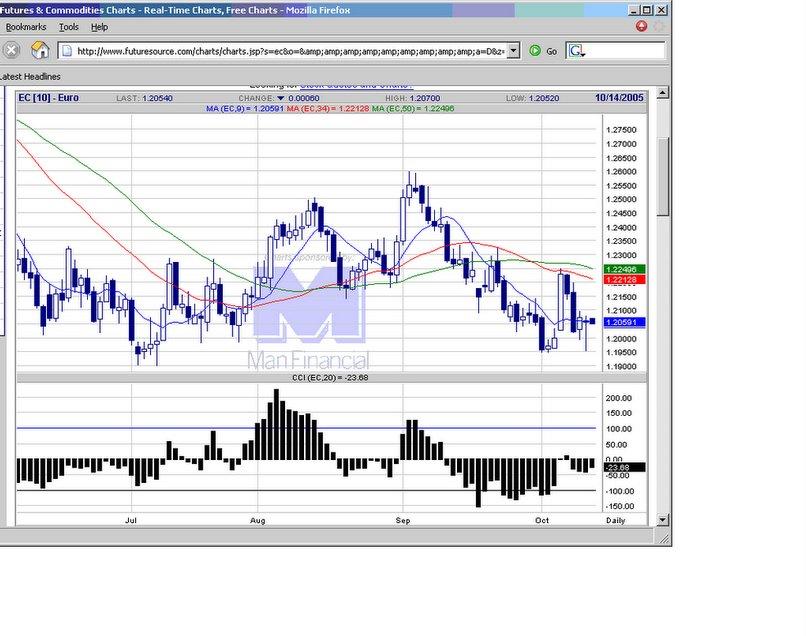 20051013 Reaction to better than expected trade gap. Was unable to hold gains for the USD. Likely to continue up for EUR futures on short covering.
EURUSD chart
20051013 Reaction to better than expected trade gap. Was unable to hold gains for the USD. Likely to continue up for EUR futures on short covering.
EURUSD chart
posted by emacro @ 8:15 PM
![]()
![]()
20051011 Big candlestick down indicates selling. Comes into area of support, but the moving average did not hold, needs to get above the mov avg to be out of downside danger.
 EURUSD chart
posted by emacro @ 12:26 AM
![]()
![]()
20051007 Moving average proves good resistance with EUR futures backing off the test.
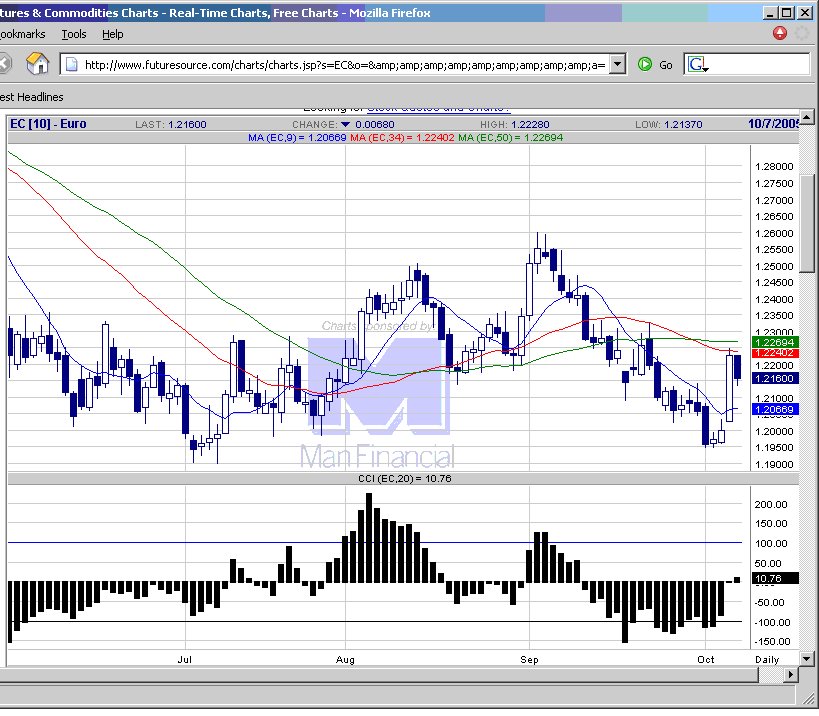 EURUSD chart
posted by emacro @ 10:12 PM
![]()
![]()
20051007 4:50am ET. 60 min chart, flattening out. Note the 8 ema which defined this upmove.
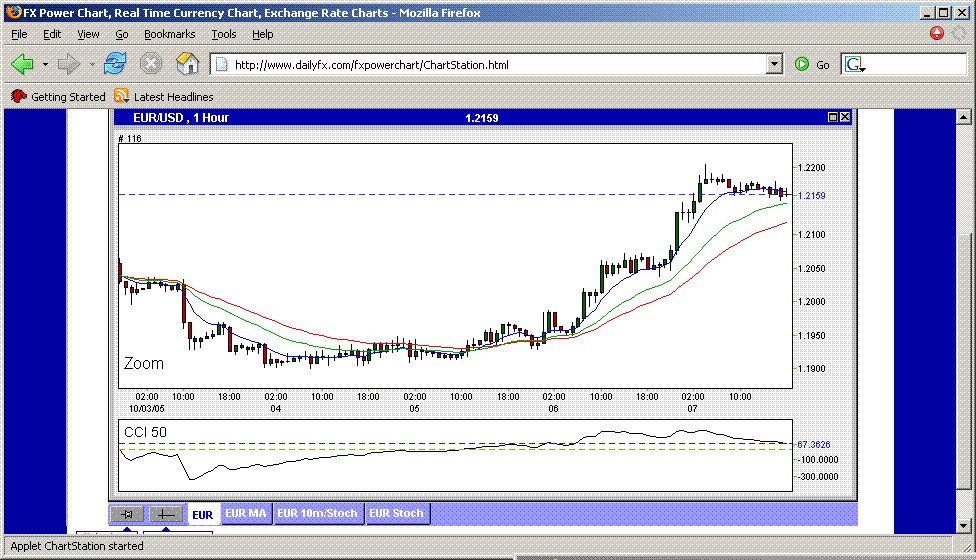 EURUSD chart
posted by emacro @ 4:56 AM
![]()
![]()
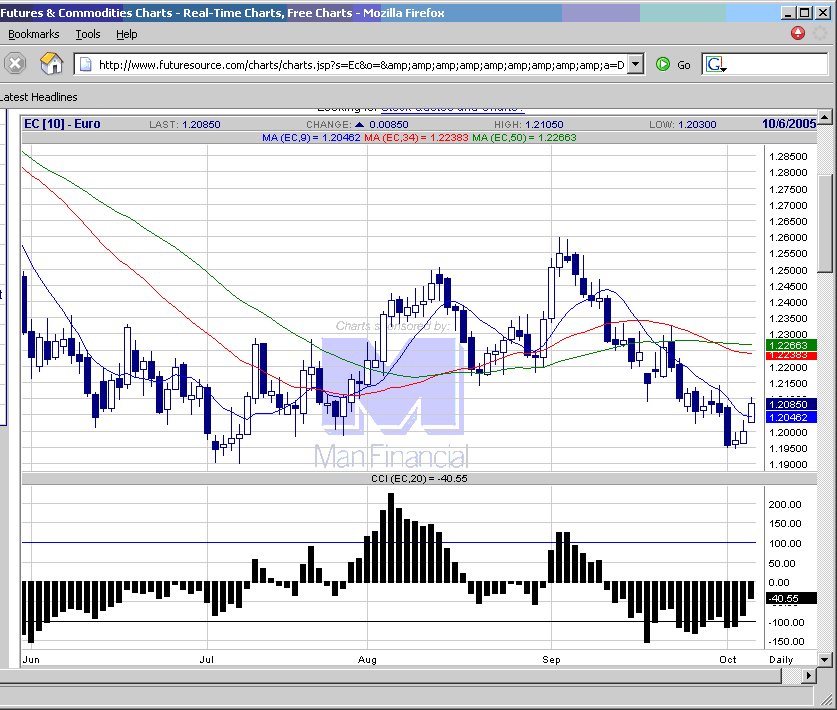
20051006 Rebound finds resistance at the 34 ema. Culd be a rangebound day today to consolidate gains.
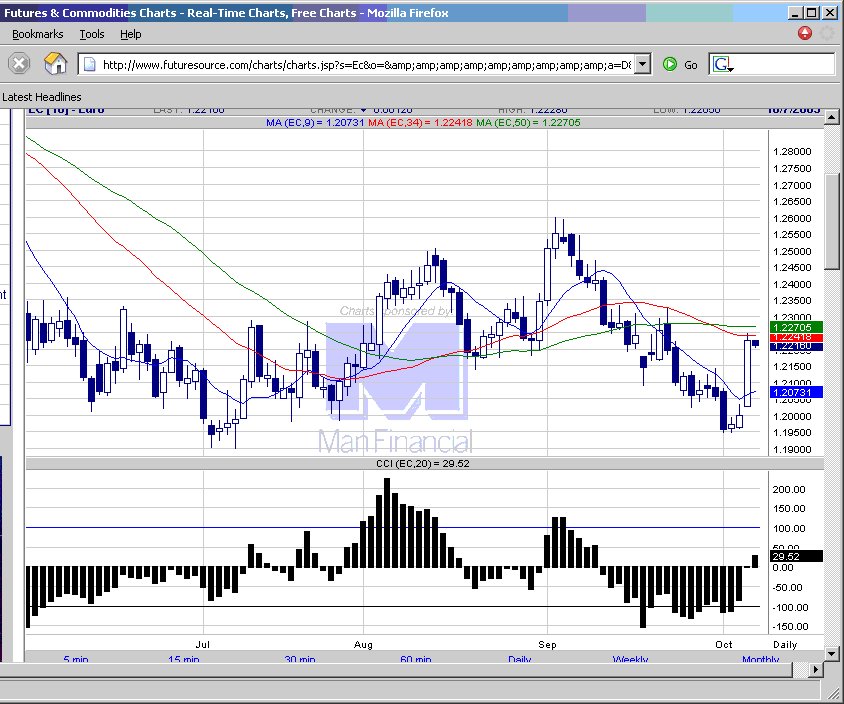 EURUSD chart
posted by emacro @ 9:24 PM
![]()
![]()
20051006 11:00 pm ET 60 min chart shows uptrend.
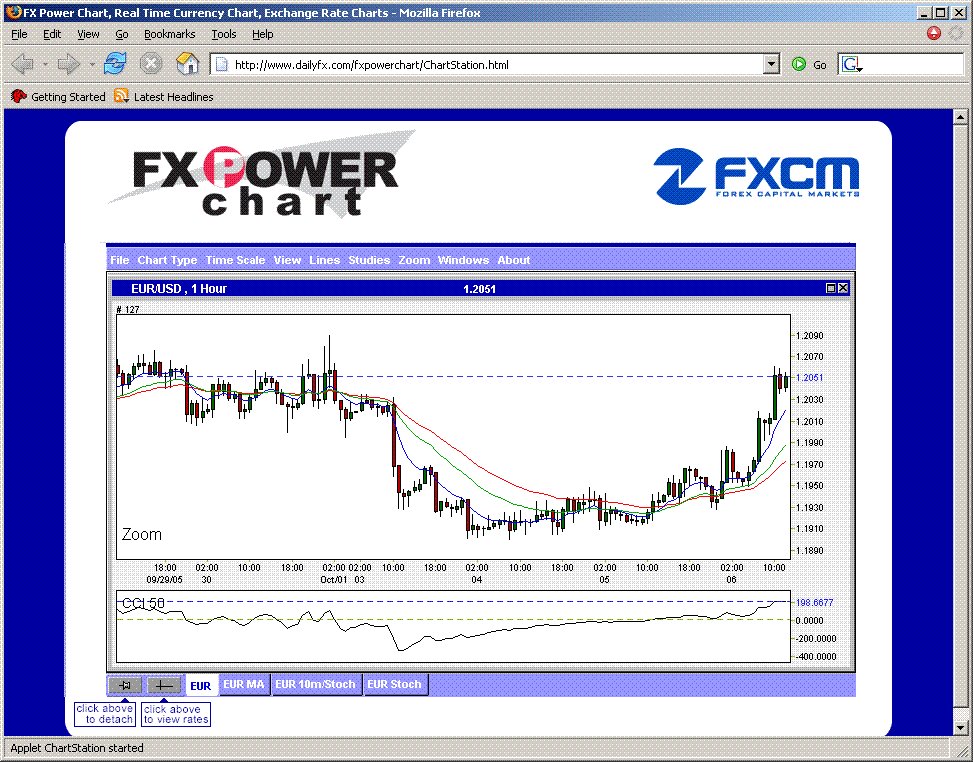 EURUSD chart
posted by emacro @ 11:07 PM
![]()
![]()
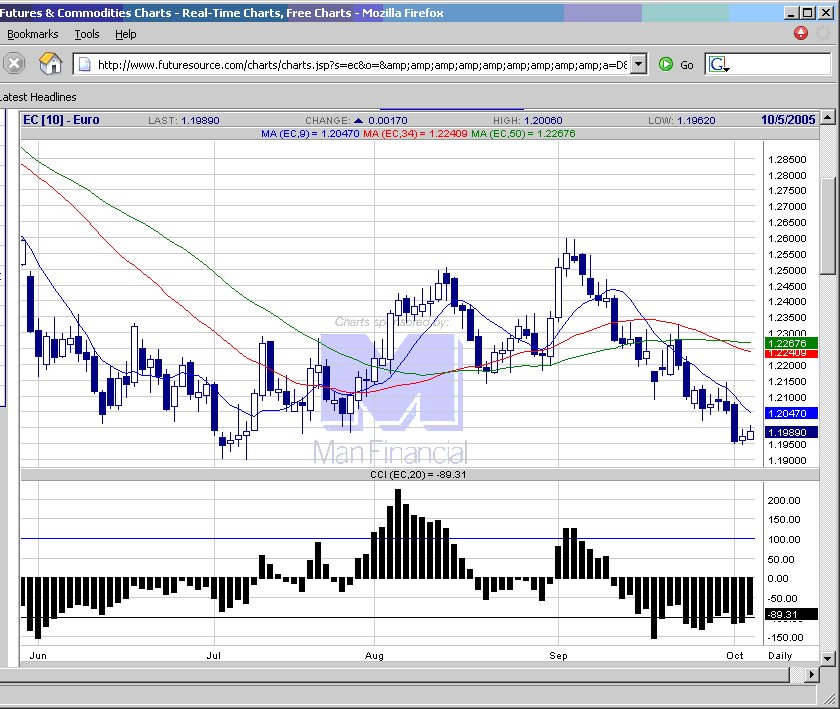
20051005 Breaks through the moving average resistance easily, making the short trade go underwater.
 EURUSD chart
posted by emacro @ 11:04 PM
![]()
![]()
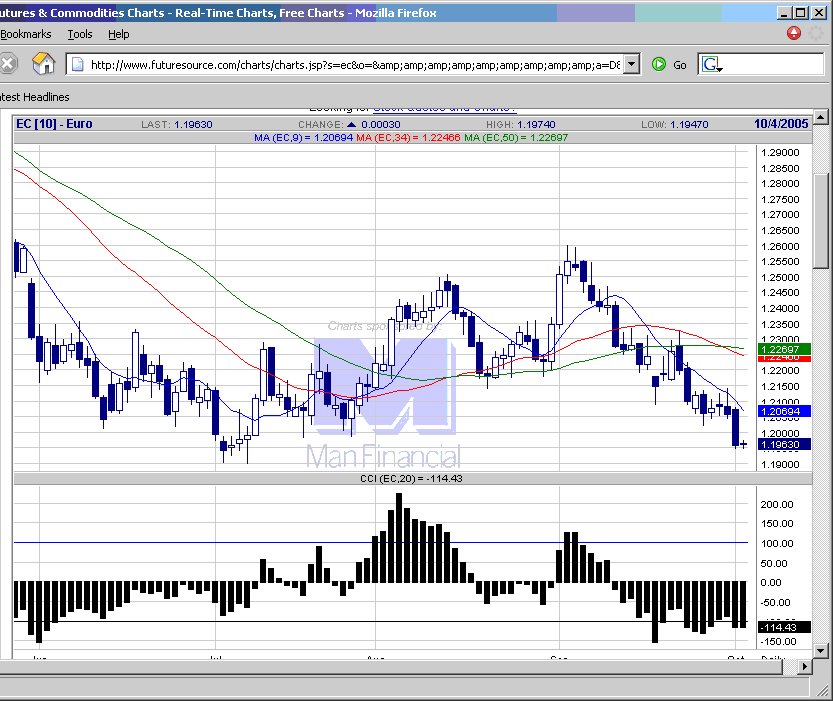
20051004 Downtrend remains intact. Could start retracing to the moving average levels, for short position consideration.
 EURUSD chart
posted by emacro @ 2:12 AM
![]()
![]()
20051003 Downtrend in place, gaining momentum. Looking for shorts off the moving average levels.
 EURUSD chart
posted by emacro @ 10:17 PM
![]()
![]()